Mini Map Macau 🚈🚌✈️🛥️


3D visualization of Macau's public transit, ferry, and aviation system, inspired by Mini Tokyo 3D and Mini Taiwan.
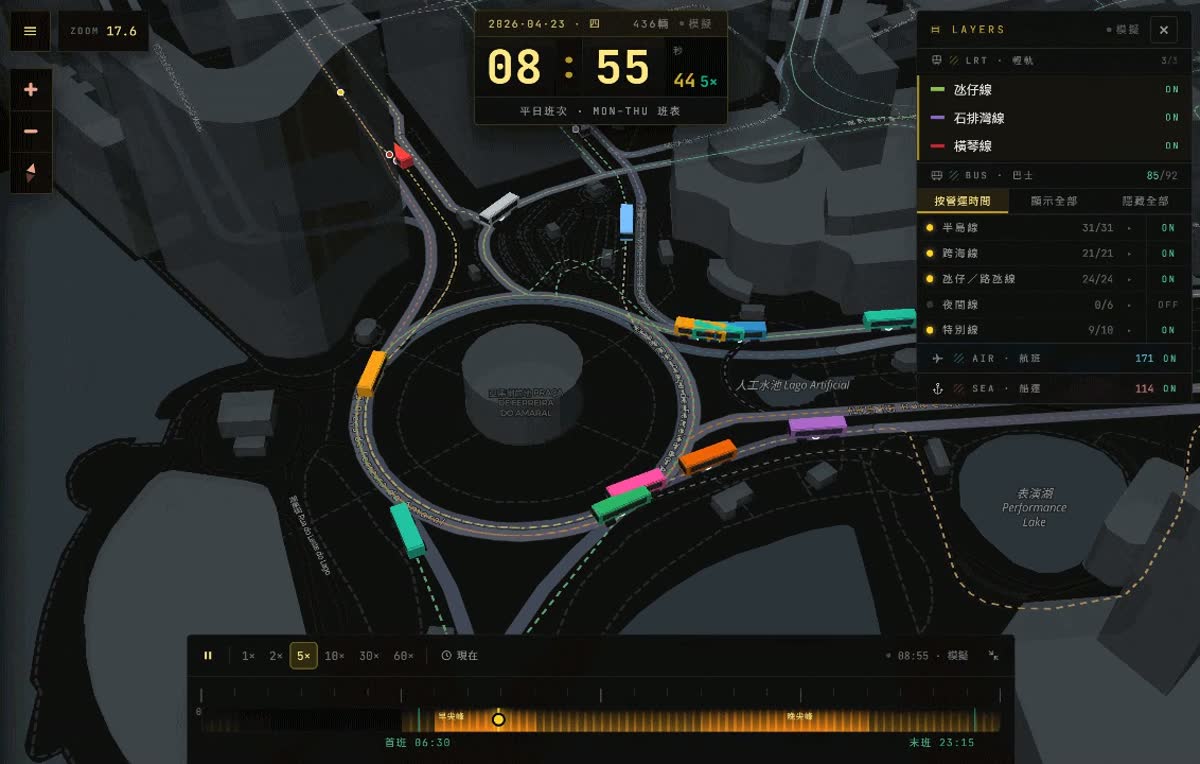
Visualizes the Macau Light Rapid Transit (LRT), bus network, HK–Macau ferry routes, and MFM airport flights on an interactive 3D map. Vehicles move along actual geometry in a timetable-driven simulation, with an opt-in RT mode that replaces simulated bus positions with live DSAT realtime data.
How "live" is this? See Data freshness & update strategy for a per-layer breakdown — LRT / buses / flights / ferries each sit at a different point on the simulated-to-live spectrum.

Contents
- Features
- Architecture
- Tech Stack
- Getting Started
- Data Pipeline
- Data Sources
- Data freshness & update strategy
- Project Structure
- Performance Notes
- Acknowledgements
- License
Features
- 3D LRT vehicles — 3 lines, 15 stations, real track geometry and elevated viaducts
- 3D Bus fleet — 92 routes, road-snapped via OSRM, with accurate cross-harbour bridge geometry
- 3D Aircraft — 176 real MFM flights (87 dep + 89 arr) with detailed airplane models, apron stands, and taxi paths
- 3D Ferries — 6 HK/Shenzhen ↔ Macau sea routes (TurboJET + CotaiJet) with jetfoil-shaped hull, red belly belt, and multi-deck cabin
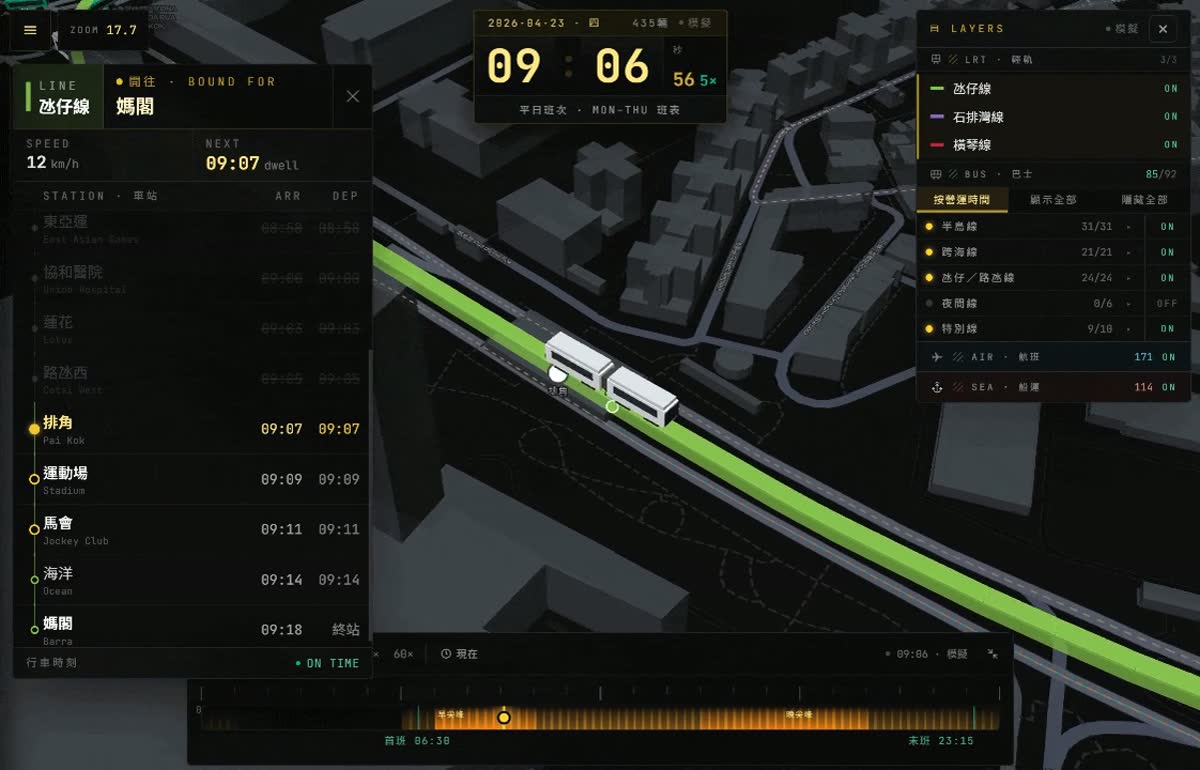
- Timetable-driven simulation — Schedule-synced playback with ETAs, service status, and trilingual labels (EN / 繁中 / PT)
- RT mode (opt-in) — Toggle replaces simulated bus positions with the DSAT live feed; simulation stays active for LRT / flights / ferries
- Time controls — Play/pause, 1×–60× speed, jump-to-now, free date/time picker
- Vehicle tracking — Click-to-follow with smooth camera and free zoom/pan
Full feature list
- 3D LRT vehicles — All 3 lines (Taipa, Seac Pai Van, Hengqin) with 15 stations, rendered as 3D models with real track geometry and elevated viaducts
- 3D Bus fleet — 92 routes with road-snapped paths via OSRM, including accurate bridge geometry (Macau–Taipa bridges)
- 3D Aircraft — 176 real MFM airport flights (87 departures + 89 arrivals) with detailed airplane models (fuselage, swept wings, vertical tail in airline colors, engine nacelles, window rows, cockpit windshield); aircraft park at 12 apron stands before departure and taxi along waypoint paths before takeoff
- Landing & holding patterns — Aircraft approach from North or South with multi-waypoint landing routes; when the runway is occupied, arriving flights enter a realistic circular holding pattern above the airport and smoothly transition back to the landing route when clear
- 3D Ferries — 6 sea routes (Hong Kong Outer Harbour / Taipa / Sheung Wan, HKIA, Shenzhen Airport, Shekou) served by TurboJET and CotaiJet, rendered as jetfoil models (pontoon hull, red belt, white TurboJET band, cabin, windows, wheelhouse, roof) following great-circle paths with wake-aware headings
- Real-time simulation — Vehicles move along routes based on timetables, service frequencies, and schedule types (Mon–Thu / Friday / Sat–Sun)
- ETA & vehicle info — Click any vehicle or station to see live ETAs, next arrivals, route details, and service status
- Flight info — Click any aircraft to see flight number, airline, destination/origin (with localized names), scheduled time, aircraft type, and live/sim status
- Ferry info — Click any ferry to see operator, route, origin/destination port (localized), scheduled departure, crossing time, and live progress
- Automated ferry data — GitHub Actions workflow scrapes TurboJET and CotaiJet timetables monthly and commits updated schedules if changed
- Time controls — Play, pause (spacebar), speed up (1×–60×), jump to current time, or pick any date/time with the DateTimePicker; Esc toggles the sidebar menu
- Vehicle tracking — Click a vehicle to follow it with smooth camera animation; freely zoom/pan while tracking
- Route visibility — Toggle individual bus routes by group (Peninsula, Cross-Harbour, Taipa/Cotai, Night, Special); auto-mode shows only routes currently in service
- 3D/2D toggle — Switch between perspective and top-down views
- Dark/Light mode — Two map styles (CARTO Dark Matter / Positron)
- Trilingual UI — English / 繁體中文 / Português — flight destinations, station names, and all labels switch with the language
- Cyberpunk-styled menu — Hamburger menu with Orbitron-font title and gradient branding
- Responsive mobile UI — Hamburger menu for map controls, compact legend buttons (LRT/Bus), optimized touch layout with safe-area support
- Lazy loading — Code-split panels (VehicleInfoPanel, StationInfoPanel, FlightInfoPanel) for fast initial load
- Automated flight data — GitHub Actions workflow syncs MFM flight schedules from the AviationStack API daily
Architecture
Three clean stages: upstream sources get normalized by Python into versioned static JSON, which the browser runtime replays on a simulated clock. RT mode adds a parallel live-feed path for buses only.
flowchart LR
  subgraph Sources["External sources"]
    OSM[OpenStreetMap]
    MLM[MLM LRT timetables]
    DSATFreq[DSAT bus frequencies]
    AS[AviationStack API]
    TJ[TurboJET · CotaiJet]
    DSATrt[DSAT realtime feed]
  end

  subgraph Pipeline["Python pipeline · GitHub Actions"]
    Scripts["data/scripts/*.py<br/>(manual regen)"]
    CronF["update-flights.yml<br/>(daily)"]
    CronFerry["update-ferry-schedules.yml<br/>(monthly)"]
  end

  subgraph Static["Bundled static JSON (public/data/)"]
    J1[lrt-lines · stations · trips]
    J2[bus-routes · bus-stops]
    J3[flights.json]
    J4[ferry-schedules.json]
  end

  subgraph Runtime["Browser runtime"]
    Sim["Simulation engine<br/>timetable-driven playback"]
    RT["RT client<br/>/api/dsat/batch · 8s cache"]
    UI[MapLibre layers + React UI]
  end

  OSM --> Scripts
  MLM --> Scripts
  DSATFreq --> Scripts
  AS --> CronF
  TJ --> CronFerry

  Scripts --> J1
  Scripts --> J2
  CronF --> J3
  CronFerry --> J4

  J1 --> Sim
  J2 --> Sim
  J3 --> Sim
  J4 --> Sim

  DSATrt -.->|opt-in RT toggle| RT
  Sim --> UI
  RT --> UI
Tech Stack
| Layer | Technology |
|---|---|
| Frontend | React 19, TypeScript 6, Vite 8 |
| 3D Map | MapLibre GL JS, custom WebGL fill-extrusion layers |
| Geo utilities | Turf.js (nearest-point-on-line) + custom precomputed-polyline cache |
| Styling | Tailwind CSS v4 |
| Fonts | Orbitron, JetBrains Mono, Noto Sans HK (Google Fonts) |
| Data pipeline | Python 3.13+, uv, OpenStreetMap Overpass API, OSRM |
| Flight data | AviationStack API (daily sync) |
| Ferry data | TurboJET + CotaiJet timetables (monthly web scraper) |
| Deployment | Cloudflare Pages (via GitHub Actions) |
| Analytics | Google Analytics (gtag.js) |
Getting Started
Prerequisites
Install & Run
npm install
npm run dev
The app will be available at http://localhost:5173.
Build for Production
npm run build
npm run preview
Data Pipeline
Transit data is pre-generated and included in public/data/.
Regenerate transit data
cd data

# Set up Python environment
uv sync

# Run all data extraction scripts
uv run python main.py
This will:
- Extract LRT track geometry from OpenStreetMap (
railway=light_railways) - Extract bus routes and stops from OpenStreetMap + motransportinfo.com reference data
- Fetch bridge approach geometry for accurate cross-harbour routing
- Snap bus routes to roads via OSRM with custom bridge geometry patching
- Generate timetables based on published service frequencies
- Output JSON files to
data/output/
Then copy the output to public/data/.
Flight data sync
Flight schedules are fetched from the AviationStack API and stored as a static JSON file:
cd data

# Fetch today's MFM flights (requires API key)
AVIATIONSTACK_API_KEY=your_key uv run python scripts/fetch_flights.py

# Fetch a specific date
AVIATIONSTACK_API_KEY=your_key uv run python scripts/fetch_flights.py 2026-04-19
The sync:
- Pulls arrivals and departures for MFM (IATA:
MFM) from the AviationStack flights endpoint - Filters by the target date's active schedule
- Validates aircraft type codes (ICAO format like A320, B738)
- Outputs
public/data/flights.jsonwith times in Macau local (UTC+8)
This is also automated via GitHub Actions (.github/workflows/update-flights.yml), which runs daily at 04:00 Macau time (UTC+8) and commits updated flight data if changed.
Ferry schedule scraper
Ferry timetables are scraped from the operator sites and stored as a single static JSON file with 6 routes across two operators (TurboJET and CotaiJet):
cd data

# Scrape the current month's schedules for all routes
uv run python scripts/fetch_ferry_schedules.py
The scraper:
- Pulls TurboJET schedules for Hong Kong (Outer Harbour), Hong Kong (Taipa), HKIA, Shenzhen Airport, and Shekou
- Pulls CotaiJet schedule for Hong Kong (Sheung Wan) ↔ Macau Taipa
- Records
fetchedAtUtcandeffectiveAsmetadata so stale data is easy to spot - Outputs
public/data/ferry-schedules.json
Automated via GitHub Actions (.github/workflows/update-ferry-schedules.yml), which runs on the 1st of each month at 00:00 UTC (08:00 Macau) and commits updates if changed.
Data Sources
- LRT tracks & stations — OpenStreetMap (railway=light_rail relations)
- LRT timetables — MLM 澳門輕軌股份有限公司 official per-station timetable publications (Taipa / Seac Pai Van / Hengqin lines)
- Bus routes & stops — OpenStreetMap + motransportinfo.com curated stop data
- Road-snapped routes — OSRM with custom bridge approach geometry
- Bus timetables — Based on published DSAT service frequencies
- Flight schedules — AviationStack API (MFM arrivals + departures)
- Ferry schedules — TurboJET + CotaiJet official monthly timetables
Data freshness & update strategy
Not every layer is equally "live." The default view is fully simulated; RT mode is the only path that touches an actual realtime feed, and even then only for buses.
| Layer | Mode | Source | Refresh cadence | Staleness indicator |
|---|---|---|---|---|
| LRT | Simulated | OSM geometry + MLM published per-station timetable | Manual regen (uv run python data/main.py) | None — static JSON |
| Bus (default) | Simulated | OSM geometry + DSAT published service frequencies | Manual regen | None — static JSON |
| Bus (RT toggle) | Live | DSAT realtime feed via nginx /api/dsat/batch proxy | Client polls every 15 s · server edge-caches 8 s | Per-bus lastAt; stale beyond 60 s window |
| Flights | Static daily sync | AviationStack API | Daily at 04:00 Macau time — update-flights.yml | fetchedAtUtc embedded in flights.json |
| Ferries | Static monthly sync | TurboJET + CotaiJet timetable pages (scraped) | 1st of month · update-ferry-schedules.yml | fetchedAtUtc + effectiveAs in ferry-schedules.json |
What each mode means
- Simulated — Vehicles are placed on pre-generated polylines and moved by the client clock using the published timetable. They don't reflect any single bus or train's actual position at that moment; they show "what the schedule says should be moving through this segment right now."
- Live (RT mode) — The client polls DSAT's realtime endpoint (a batch fan-out proxied through nginx with an 8 s shared cache). DSAT itself only publishes current-stop, direction, and speed per plate — not continuous GPS — so the client interpolates between consecutive stop reports. RT mode is opt-in via the control-panel toggle; when off, buses fall back to the simulated timetable.
- Static sync — A scheduled GitHub Actions job fetches upstream data and commits a new
public/data/*.jsonif it changed. The app reads whatever was in the last build; there is no per-page-load fetch for flights or ferries.
Project Structure
File tree
mini-macau/
├── src/
│   ├── components/
│   │   ├── MapView.tsx           # Main map + hamburger menu
│   │   ├── ControlPanel.tsx      # Playback speed controls
│   │   ├── TimeDisplay.tsx       # Clock + DateTimePicker trigger
│   │   ├── DateTimePicker.tsx    # Date/time selection overlay
│   │   ├── LineLegend.tsx        # LRT/Bus/Flight legend (desktop + mobile)
│   │   ├── VehicleInfoPanel.tsx  # Vehicle detail + ETA
│   │   ├── StationInfoPanel.tsx  # Station detail + next arrivals
│   │   ├── FlightInfoPanel.tsx   # Flight detail panel
│   │   └── FerryInfoPanel.tsx    # Ferry detail panel
│   ├── engines/
│   │   └── simulationEngine.ts   # Timetable-driven vehicle + flight position computation
│   ├── hooks/
│   │   ├── useSimulationClock.ts # RAF-based clock with speed/pause
│   │   └── useTransitData.ts     # JSON data loader
│   ├── layers/
│   │   ├── Bus3DLayer.ts         # 3D bus model (fill-extrusion)
│   │   ├── LRT3DLayer.ts         # 3D LRT model (fill-extrusion)
│   │   ├── Flight3DLayer.ts      # 3D airplane model (fill-extrusion)
│   │   ├── Ferry3DLayer.ts       # 3D jetfoil model (fill-extrusion, 8 layers)
│   │   └── VehicleLayer.ts       # 2D vehicle circles + labels
│   ├── App.tsx                   # Root layout + state management
│   ├── main.tsx                  # React entry point with I18nProvider
│   ├── routeGroups.ts            # Bus route grouping logic
│   ├── i18n.tsx                  # Internationalization (EN / 繁中 / PT)
│   ├── types.ts                  # TypeScript interfaces
│   └── index.css                 # Tailwind + MapLibre control overrides
├── public/
│   ├── data/
│   │   ├── lrt-lines.json
│   │   ├── stations.json
│   │   ├── trips.json
│   │   ├── bus-routes.json
│   │   ├── bus-stops.json
│   │   ├── flights.json          # MFM flight schedules (with localized names)
│   │   └── ferry-schedules.json  # TurboJET + CotaiJet monthly timetables
│   ├── favicon.svg
│   ├── icons.svg
│   ├── og-image.png
│   ├── sitemap.xml
│   └── robots.txt
├── data/
│   ├── scripts/
│   │   ├── extract_lrt_osm.py
│   │   ├── extract_bus_data.py
│   │   ├── fetch_bus_data.py
│   │   ├── fetch_bridge_geometry.py
│   │   ├── fetch_flights.py      # AviationStack flight data sync (MFM)
│   │   ├── fetch_ferry_schedules.py # TurboJET + CotaiJet monthly scraper
│   │   ├── osrm_route.py
│   │   ├── patch_bus_bridges.py
│   │   └── generate_timetable.py
│   ├── bus_reference/
│   ├── output/
│   └── main.py
├── .github/workflows/
│   ├── deploy.yml                  # Cloudflare Pages CI/CD
│   ├── docker-release.yml          # Docker image release on new tag
│   ├── service-status.yml          # Upstream service availability check
│   ├── update-flights.yml          # Daily flight data update
│   └── update-ferry-schedules.yml  # Monthly ferry data update
└── index.html
Performance Notes
Simulating 300–400 moving vehicles at 20 Hz while MapLibre re-draws 3D extrusions every frame puts real pressure on the main thread. A few optimizations worth calling out:
Polyline progress lookup — cumKm + binary search
The simulation asks the same question once per vehicle per tick: given a route and a progress ∈ [0, 1], where on the polyline is the vehicle, and which way is it facing?
The original implementation used Turf's along twice per vehicle (once for position, once for a 1-metre-ahead lookahead to derive bearing). along walks the coordinate array from index 0 and sums haversine distances until it reaches the target km — O(n) haversines per call. At ~400 vehicles × 2 calls × 20 Hz × 100-point routes, that worked out to roughly 12 000 full-route scans per second, all on the main thread.
Key observation: each route's geometry is immutable, so the per-segment work only needs to happen once. On first touch we cache:
cumKm[i]— cumulative kilometres fromcoords[0]tocoords[i](Float64Array)segBearing[i]— heading of segmentcoords[i] → coords[i+1](Float64Array)
Per-call cost then collapses to a binary search on cumKm (≈ 8 comparisons for a 150-point route), a linear interpolation between two lat/lng pairs, and a table lookup for bearing. No trig in the hot loop, and no second along call since the segment index already tells us the heading.
We deliberately don't cache a per-line "last index" hint: multiple vehicles share the same polyline at different progress values, so a shared hint would thrash. O(log n) is cheap enough that per-vehicle state isn't worth it. See simulationEngine.ts (getLineCache / interpolateOnLine).
One bus-routes source instead of 92
MapLibre GeoJSON sources are tiled in a web worker: the worker clips each source's features to tile boundaries, tessellates lines into triangle strips, and ships vertex buffers back to the main thread. Originally each of the 92 bus routes was its own addSource + addLayer, meaning every zoom level change forced 92 separate postMessage round-trips and 92 independent tile-index rebuilds.
Consolidating into a single bus-routes source (one tile index, one round-trip per reindex) drastically cut worker chatter during zoom. Per-route dimming — previously setPaintProperty('bus-route-${id}', 'line-opacity', …) against 92 layers — became setFeatureState({ source: 'bus-routes', id }, { inService }) on one layer, with opacity driven by a ['case', ['==', ['feature-state', 'inService'], false], DIM, FULL] paint expression. setFeatureState doesn't recompile paint; setPaintProperty does.
Two-tier animation throttle
Moving 300+ buses as 3D fill-extrusion polygons is heavy (each bus is 8 quads × lat/lng math). Moving them as 2D circles is almost free (just a setData on a Point FeatureCollection).
The animate loop splits them: simulation + 2D circle updates run every 50 ms unconditionally, while 3D polygon rebuilds throttle to 160 ms whenever the map is actively moving (movestart / moveend set a mapBusy flag). During zoom gestures the 2D layer keeps vehicles visibly moving at full cadence while the expensive 3D rebuild backs off, leaving MapLibre's own render pipeline more time to finish zoom frames.
Decouple zoom display from React re-renders
The zoom indicator in the HUD used to be a useState, so every map.on('zoom', …) event caused <MapView> to re-render — which is a huge component with map refs, ETA panels, and layer toggles. Now zoom lives in an external store read via useSyncExternalStore, and only a tiny <ZoomText> leaf subscribes. The rest of <MapView> stays stable during pinch/scroll zoom.
Acknowledgements
Inspiration
- Mini Tokyo 3D — Original inspiration for the concept
- Mini Taiwan — Sister project inspiration
Data sources
- OpenStreetMap — LRT track geometry, bus routes, and stop locations
- MLM 澳門輕軌股份有限公司 — Official per-station LRT timetables (used to hand-transcribe
data/scripts/generate_timetable.pyfor the Taipa / Seac Pai Van / Hengqin lines) - MoTransport Info — Curated Macau bus stop reference data
- DSAT 巴士資訊 — Official Macau bus realtime feed (live bus positions in RT mode)
- AviationStack — MFM flight schedule data (arrivals + departures)
- TurboJET — Ferry timetable (Hong Kong, HKIA, Shenzhen Airport, Shekou routes)
- CotaiJet — Ferry timetable (Hong Kong ↔ Macau Taipa route)
Libraries, tiles, and fonts
- MapLibre GL JS — Open-source map rendering
- CARTO — Basemap tiles (Dark Matter / Positron)
- OpenFreeMap — 3D building tiles
- OSRM — Road routing engine
- Turf.js — Geospatial analysis
- Google Fonts — Orbitron, JetBrains Mono, Noto Sans HK