 # ESP-IDF Extension for VS Code
[中文](./README_CN.md)
[](https://docs.espressif.com/projects/vscode-esp-idf-extension/en/latest/)
[](./README.md#Troubleshooting)

[](https://github.com/espressif/vscode-esp-idf-extension/releases)
[](https://esp32.com/viewforum.php?f=40)
Develop, build, flash, monitor, debug and [more](https://docs.espressif.com/projects/vscode-esp-idf-extension/en/latest/index.html) with Espressif chips using Espressif IoT Development Framework [(ESP-IDF)](https://github.com/espressif/esp-idf).
**Latest master installer** for Visual Studio Code. You can use this VSIX to test the current github master of the extension by pressing F1 or click menu `View` -> `Command Palette...`, type `Install from VSIX` and then select the previously downloaded `.vsix` file to install the extension.
Make sure to review our [Espressif documentation](https://docs.espressif.com/projects/vscode-esp-idf-extension/en/latest/index.html) first to properly use the extension.
# How to use
## Install
1. Download and install [Visual Studio Code](https://code.visualstudio.com/).
2. Install ESP-IDF system prerequisites for your operating system:
- Prerequisites for [MacOS and Linux](https://docs.espressif.com/projects/esp-idf/en/latest/esp32/get-started/linux-macos-setup.html).
- For Windows there is no additional prerequisites.
3. In Visual Studio Code, Open the **Extensions** view by clicking on the Extension icon in the Activity Bar on the side of Visual Studio Code or the **View: Show Extensions** command (shortcut: ⇧ ⌘ X or Ctrl+Shift+X).
4. Search for [ESP-IDF Extension](https://marketplace.visualstudio.com/items?itemName=espressif.esp-idf-extension).
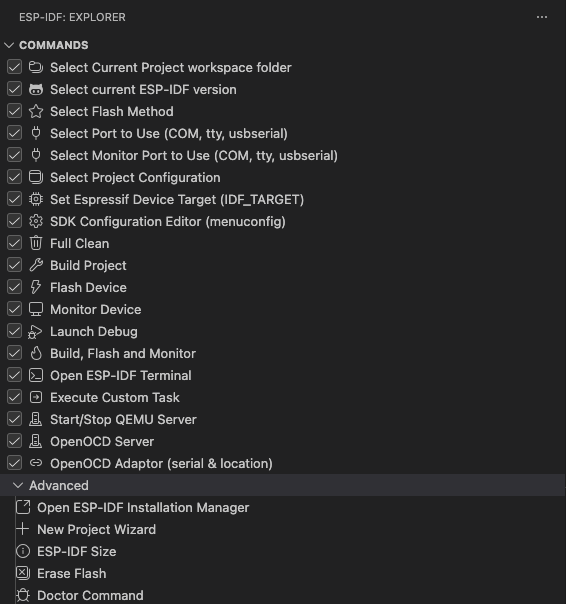
5. Install the extension. After you install the extension, the  should appear in the VS Code Activity bar (left side set of icons). When you click the Espressif icon, you can see a list of basic commands provided by this extension.
# ESP-IDF Extension for VS Code
[中文](./README_CN.md)
[](https://docs.espressif.com/projects/vscode-esp-idf-extension/en/latest/)
[](./README.md#Troubleshooting)

[](https://github.com/espressif/vscode-esp-idf-extension/releases)
[](https://esp32.com/viewforum.php?f=40)
Develop, build, flash, monitor, debug and [more](https://docs.espressif.com/projects/vscode-esp-idf-extension/en/latest/index.html) with Espressif chips using Espressif IoT Development Framework [(ESP-IDF)](https://github.com/espressif/esp-idf).
**Latest master installer** for Visual Studio Code. You can use this VSIX to test the current github master of the extension by pressing F1 or click menu `View` -> `Command Palette...`, type `Install from VSIX` and then select the previously downloaded `.vsix` file to install the extension.
Make sure to review our [Espressif documentation](https://docs.espressif.com/projects/vscode-esp-idf-extension/en/latest/index.html) first to properly use the extension.
# How to use
## Install
1. Download and install [Visual Studio Code](https://code.visualstudio.com/).
2. Install ESP-IDF system prerequisites for your operating system:
- Prerequisites for [MacOS and Linux](https://docs.espressif.com/projects/esp-idf/en/latest/esp32/get-started/linux-macos-setup.html).
- For Windows there is no additional prerequisites.
3. In Visual Studio Code, Open the **Extensions** view by clicking on the Extension icon in the Activity Bar on the side of Visual Studio Code or the **View: Show Extensions** command (shortcut: ⇧ ⌘ X or Ctrl+Shift+X).
4. Search for [ESP-IDF Extension](https://marketplace.visualstudio.com/items?itemName=espressif.esp-idf-extension).
5. Install the extension. After you install the extension, the  should appear in the VS Code Activity bar (left side set of icons). When you click the Espressif icon, you can see a list of basic commands provided by this extension.

| Category | Command | Description | Keyboard Shortcuts (Mac) | Keyboard Shortcuts (Windows/Linux) |
|---|---|---|---|---|
| Settings | Add Docker Container Configuration | Add the .devcontainer files to the currently opened project directory, necessary to use a ESP-IDF project in a Docker container with Visual Studio Code Dev Containers extension. | ||
| Add VS Code Configuration Folder | Add .vscode files to the currently opened project directory. This includes launch.json (for debugging), settings.json and c_cpp_properties.json (for syntax highlight). | |||
| Open ESP-IDF Installation Manager | Open ESP-IDF Installation Manager (EIM) to install ESP-IDF, IDF Tools and Python virtual environment. | |||
| Select Output and Notification Mode | This extension shows many notifications and output in the Output window ESP-IDF. This command allows you to set if to show notifications only, output only, both notifications and output, or neither. | |||
| Select Where to Save Configuration Settings | In Visual Studio Code, settings can be saved in 3 places: User Settings (global settings), workspace ( .code-workspace file) or workspace folder (.vscode/settings.json). More information in working with multiple projects. | |||
| Pick a Workspace Folder | When using a Visual Studio Code workspace with multiple folders, this command allows you to choose which workspace folder to apply this extension's commands to. More information in working with multiple projects. | |||
| Basic | Set Espressif Device Target | This will set the target for the current project (IDF_TARGET). Similar to idf.py set-target. For example, if you want to use ESP32 or ESP32-C3, you need to execute this command. | ||
| SDK Configuration Editor | Launch a UI to configure your ESP-IDF project settings. This is equivalent to idf.py menuconfig. | ⌘ I G | Ctrl E G | |
| Build Your Project | Build your project using `CMake` and `Ninja-build` as explained in ESP-IDF Build System Using Cmake Directly. You could modify the behavior of the build task with idf.cmakeCompilerArgs for Cmake configure step and idf.ninjaArgs for Ninja step. For example, using [-j N] where N is the number of jobs run in parallel. | ⌘ I B | Ctrl E B | |
| Size Analysis of the Binaries | Launch UI with the ESP-IDF project binaries size information. | ⌘ I S | Ctrl E S | |
| Select Port to Use | Select which serial port to use for ESP-IDF tasks, such as flashing or monitoring your device. | ⌘ I P | Ctrl E P | |
| Flash Your Project | Write binary data to the ESP's flash chip from your current ESP-IDF project. This command will use either UART, DFU or JTAG based on idf.flashType. | ⌘ I F | Ctrl E F | |
| Monitor Device | This command will execute idf.py monitor to start serial communication with Espressif device. Please take a look at the IDF Monitor. | ⌘ I M | Ctrl E M | |
| Open ESP-IDF Terminal | Launch a terminal window configured with extension ESP-IDF settings. Similar to export.sh script from ESP-IDF CLI. | ⌘ I T | Ctrl E T | |
| Select OpenOCD Board Configuration | Select the OpenOCD configuration files that match your Espressif device target, such as DevKitC or ESP-Wrover-Kit. This is necessary for flashing with JTAG or debugging your device. | |||
| Build, Flash and Start a Monitor on Your Device | Build the project, write binaries program to device and start a monitor terminal with a single command. Similar to idf.py build flash monitor. | ⌘ I D | Ctrl E D | |
| Project creation | Create New ESP-IDF Component | Create a new component in the current directory based on ESP-IDF component template. | ||
| Create New Empty Project | Ask for the new project name, choose the directory to create the project, and show a notification to open the newly created project. | |||
| Import ESP-IDF Project | Import an existing ESP-IDF project, add .vscode and .devcontainer files to a new location, and optionally rename the project. | |||
| New Project | Launch UI with a ESP-IDF project creation wizard using example templates from ESP-IDF and additional frameworks configured in the extension. | ⌘ I N | Ctrl E N | |
| Flashing | Select Flash Method | Select which flash method to use for Flash Your Project command. It can be DFU, JTAG or UART. | ||
| Flash Your Project | Write binary data to the ESP's flash chip from your current ESP-IDF project. This command will use either UART, DFU or JTAG based on idf.flashType | ⌘ I F | Ctrl E F | |
| Flash (DFU) Your Project | Write binary data to the ESP's flash chip from your current ESP-IDF project using DFU. Only for ESP32-S2 and ESP32-S3. | |||
| Flash (UART) Your Project | Write binary data to the ESP's flash chip from your current ESP-IDF project using esptool.py. | |||
| Flash (with JTAG) | Write binary data to the ESP's flash chip from your current ESP-IDF project using OpenOCD JTAG. | |||
| Encrypt and Flash Your Project | Execute flashing the project program to device while adding --encrypt for partitions to be encrypted. | |||
| Erase Flash Memory from Device | Execute esptool.py erase_flash command to erase flash chip (set to 0xFF bytes). | ⌘ I R | Ctrl E R | |
| Code coverage | Add Editor Coverage | Parse your project GCOV code coverage files to add color lines representing code coverage on currently opened source code file. | ||
| Configure Project SDKConfig for Coverage | Set required values in your project SDKConfig to enable code coverage analysis. | |||
| Get HTML Coverage Report for Project | Parse your project GCOV code coverage files to generate a HTML coverage report. | |||
| Remove Editor Coverage | Remove editor colored lines from Add Editor Coverage command | |||
| Additional frameworks | Install ESP-ADF | Clone ESP-ADF inside the selected directory and set ADF_PATH in idf.customExtraVars configuration setting. | ||
| Add Arduino ESP32 as ESP-IDF Component | Add Arduino-ESP32 as a ESP-IDF component in your current directory (${CURRENT_DIRECTORY}/components/arduino). | |||
| eFuse | Get eFuse Summary | Retrieve a list of eFuses and their corresponding values from the chip currently connected to the serial port and display in the ESP Explorer EFUSEEXPLORER. | ||
| Clear eFuse Summary | Clear the eFuse Summary tree from ESP Explorer EFUSEEXPLORER. | |||
| QEMU | Launch QEMU Server | As described in QEMU documentation, this command will execute ESP32 QEMU from the project Dockerfile with the current project binaries. | ||
| Launch QEMU Debug Session | As described in QEMU documentation, this command will start a debug session to ESP32 QEMU from the project Dockerfile with the current project binaries. | |||
| Monitor QEMU Device | As described in QEMU documentation, this command will start a terminal to monitor the ESP32 QEMU from the project Dockerfile with the current project binaries. | |||
| Monitoring | Monitor Device | This command will execute idf.py monitor to start serial communication with Espressif device. Please take a look at the IDF Monitor Documentation. | ⌘ I M | Ctrl E M |
| Launch IDF Monitor for Core Dump Mode/GDB Stub Mode | Launch ESP-IDF Monitor with WebSocket capabilities. If you has configured the panic handler to gdbstub or core dump, the monitor will launch a post-mortem debug session of the chip. | |||
| Monitor QEMU Device | As described in QEMU documentation, this command will start a terminal to monitor the ESP32 QEMU from the project Dockerfile with the current project binaries. | |||
| Editors | NVS Partition Editor | Launch UI to create a CSV file for ESP-IDF Non-Volatile Storage Library. | ||
| Partition Table Editor | Launch UI to manage custom partition table as described in ESP-IDF Partition Tables. | |||
| SDK Configuration Editor | Launch a UI to configure your ESP-IDF project settings. This is equivalent to idf.py menuconfig. | ⌘ I G | Ctrl E G | |
| Unit Testing | "Unit Test: Build Unit Test App" | Copy the unit test app in the current project, build the current project. More information in Unit testing documentation. | ||
| Unit Test: Flash Unit Test App | Flash the unit test application to the connected device. More information in Unit testing documentation. | |||
| Unit Test: Build and Flash Unit Test App for Testing | Copy the unit test app in the current project, build the current project and flash the unit test application to the connected device. More information in Unit testing documentation. | |||
| Scripts and Tools | Run idf.py reconfigure Task | This command will execute idf.py reconfigure (CMake configure task), which is useful for generating compile_commands.json for the C/C++ language support. | ||
| Erase Flash Memory from Device | Execute esptool.py erase_flash command to erase flash chip (set to 0xFF bytes). | ⌘ I R | Ctrl E R | |
| Dispose of Current SDK Configuration Editor Server Process | If you already executed the SDK Configuration Editor, a cache process will remain in the background for faster reopening. This command will dispose of such cache process. | |||
| Doctor Command | Run a diagnostic of the extension setup settings and extension logs to provide a troubleshooting report. | |||
| Troubleshoot Form | Launch UI for user to send a troubleshoot report with steps to reproduce. Run a diagnostic of the extension setup settings and extension logs to send to telemetry backend. | |||
| Run ESP-IDF-SBOM Vulnerability Check | Creates Software bill of materials (SBOM) files in the Software Package Data Exchange (SPDX) format for applications generated by the Espressif IoT Development Framework (ESP-IDF). | |||
| Save Default SDKCONFIG File (save-defconfig) | Generate sdkconfig.defaults files using the project current sdkconfig file. | |||
| Show Ninja Build Summary | Execute the Chromium ninja-build-summary.py. | |||
| Search in documentation... | Select some text from your source code file and search in ESP-IDF documentation with results right in the VS Code ESP-IDF Explorer tab. | ⌘ I Q | Ctrl E Q | |
| Search Error Hint | Type some text to find a matching error from ESP-IDF hints dictionary. | |||
| Load Image from LVGL C File | Load and display an image from a LVGL C file containing lv_image_dsc_t structure. This command allows you to view LVGL images without requiring a debug session. | |||
| Open Image Viewer | Open the Image Viewer panel to display images from debug variables or LVGL C files. This panel provides tools for viewing and analyzing image data in various formats. | |||
| Cleanup | Clear ESP-IDF Search Results | Clear results from ESP Explorer Documentation Search Results. |