OpenTerminal
A Terminal‑style workspace for the rest of us — built entirely on free, public market data.
Dark. Dense. Keyboard‑driven. Zero paid API keys, zero subscriptions.




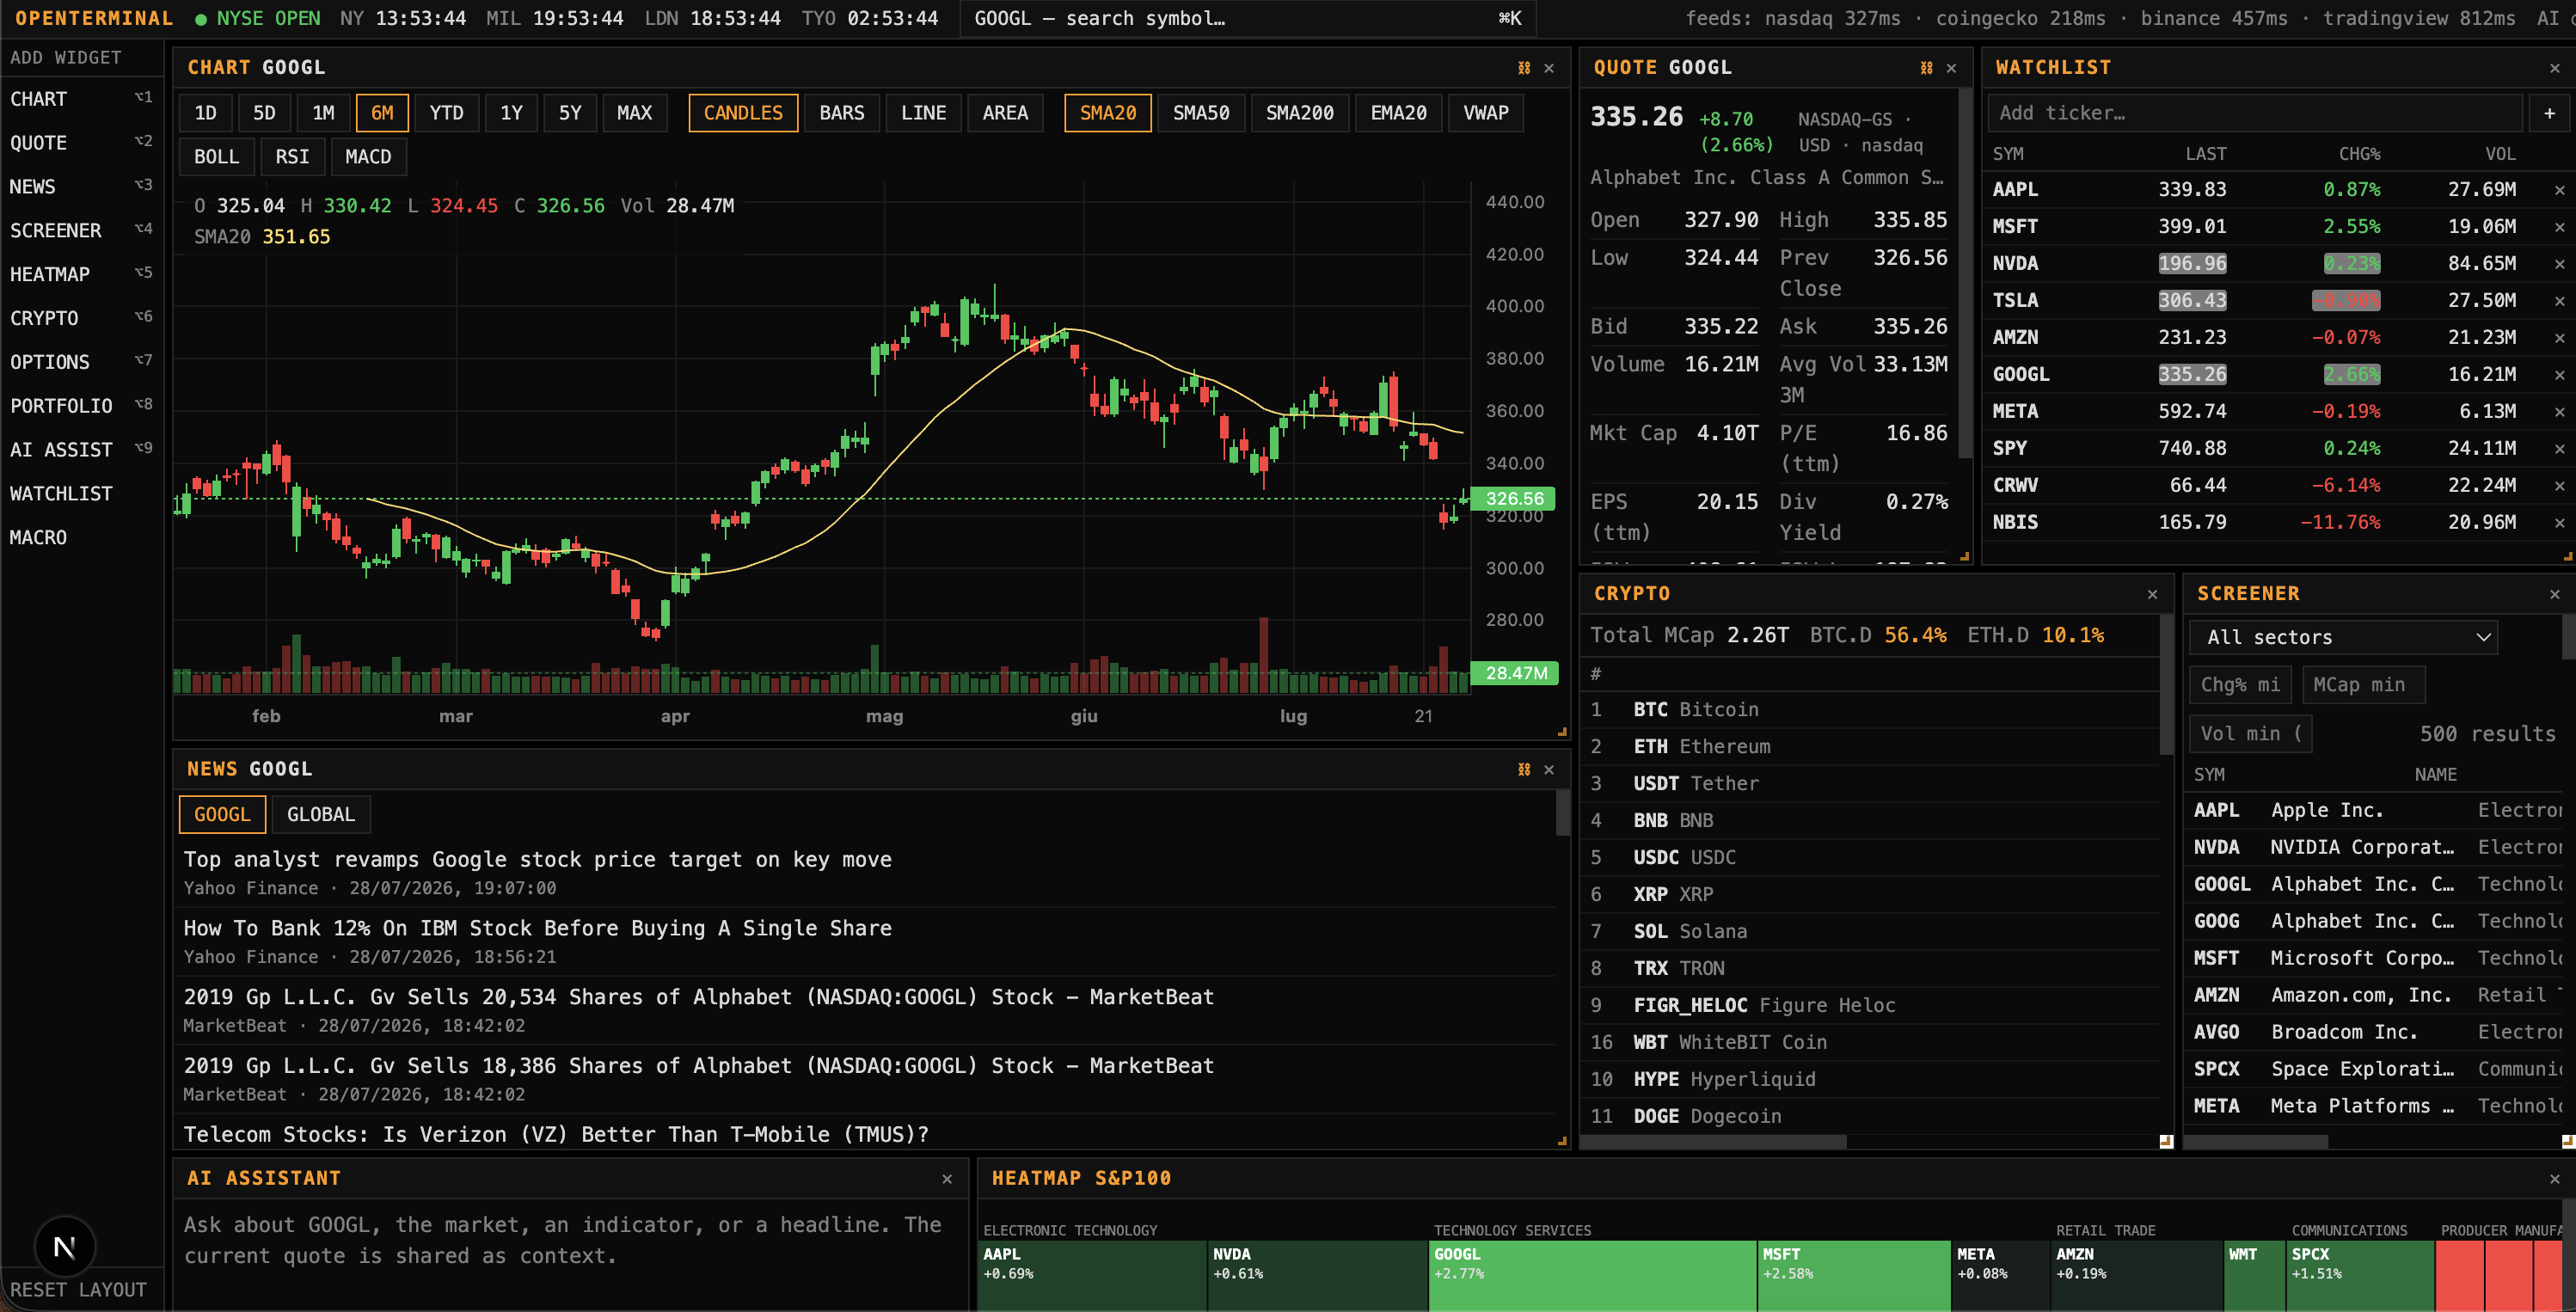
⭐ If this is useful to you, consider starring the repo — it genuinely helps other people find it.
Why OpenTerminal?
Real trading terminals cost $2,000+ a month. Most retail dashboards either lock the good stuff behind a paywall or run on a single flaky data source that breaks the moment you actually need it.
OpenTerminal takes a different approach: it stitches together several free, publicly documented (or reverse‑engineered but widely used) market data endpoints — the same ones that power major finance sites' own front ends — into one fast, keyboard‑first, widget‑based dashboard that runs entirely on your machine. Every data endpoint has an automatic fallback chain, so a single provider hiccup never takes the whole app down.
No signup. No credit card. No rate‑limited demo tier. Clone it, npm install, and you have a live terminal in under a minute.
✨ Features
- 🖥️ Widget-based workspace — drag, resize, add, and remove panels (
react-grid-layout); your layout is saved locally and restored on reload - ⌘K global command palette — instantly search stocks, ETFs, and crypto and jump straight to them
- 📈 Professional charting (via
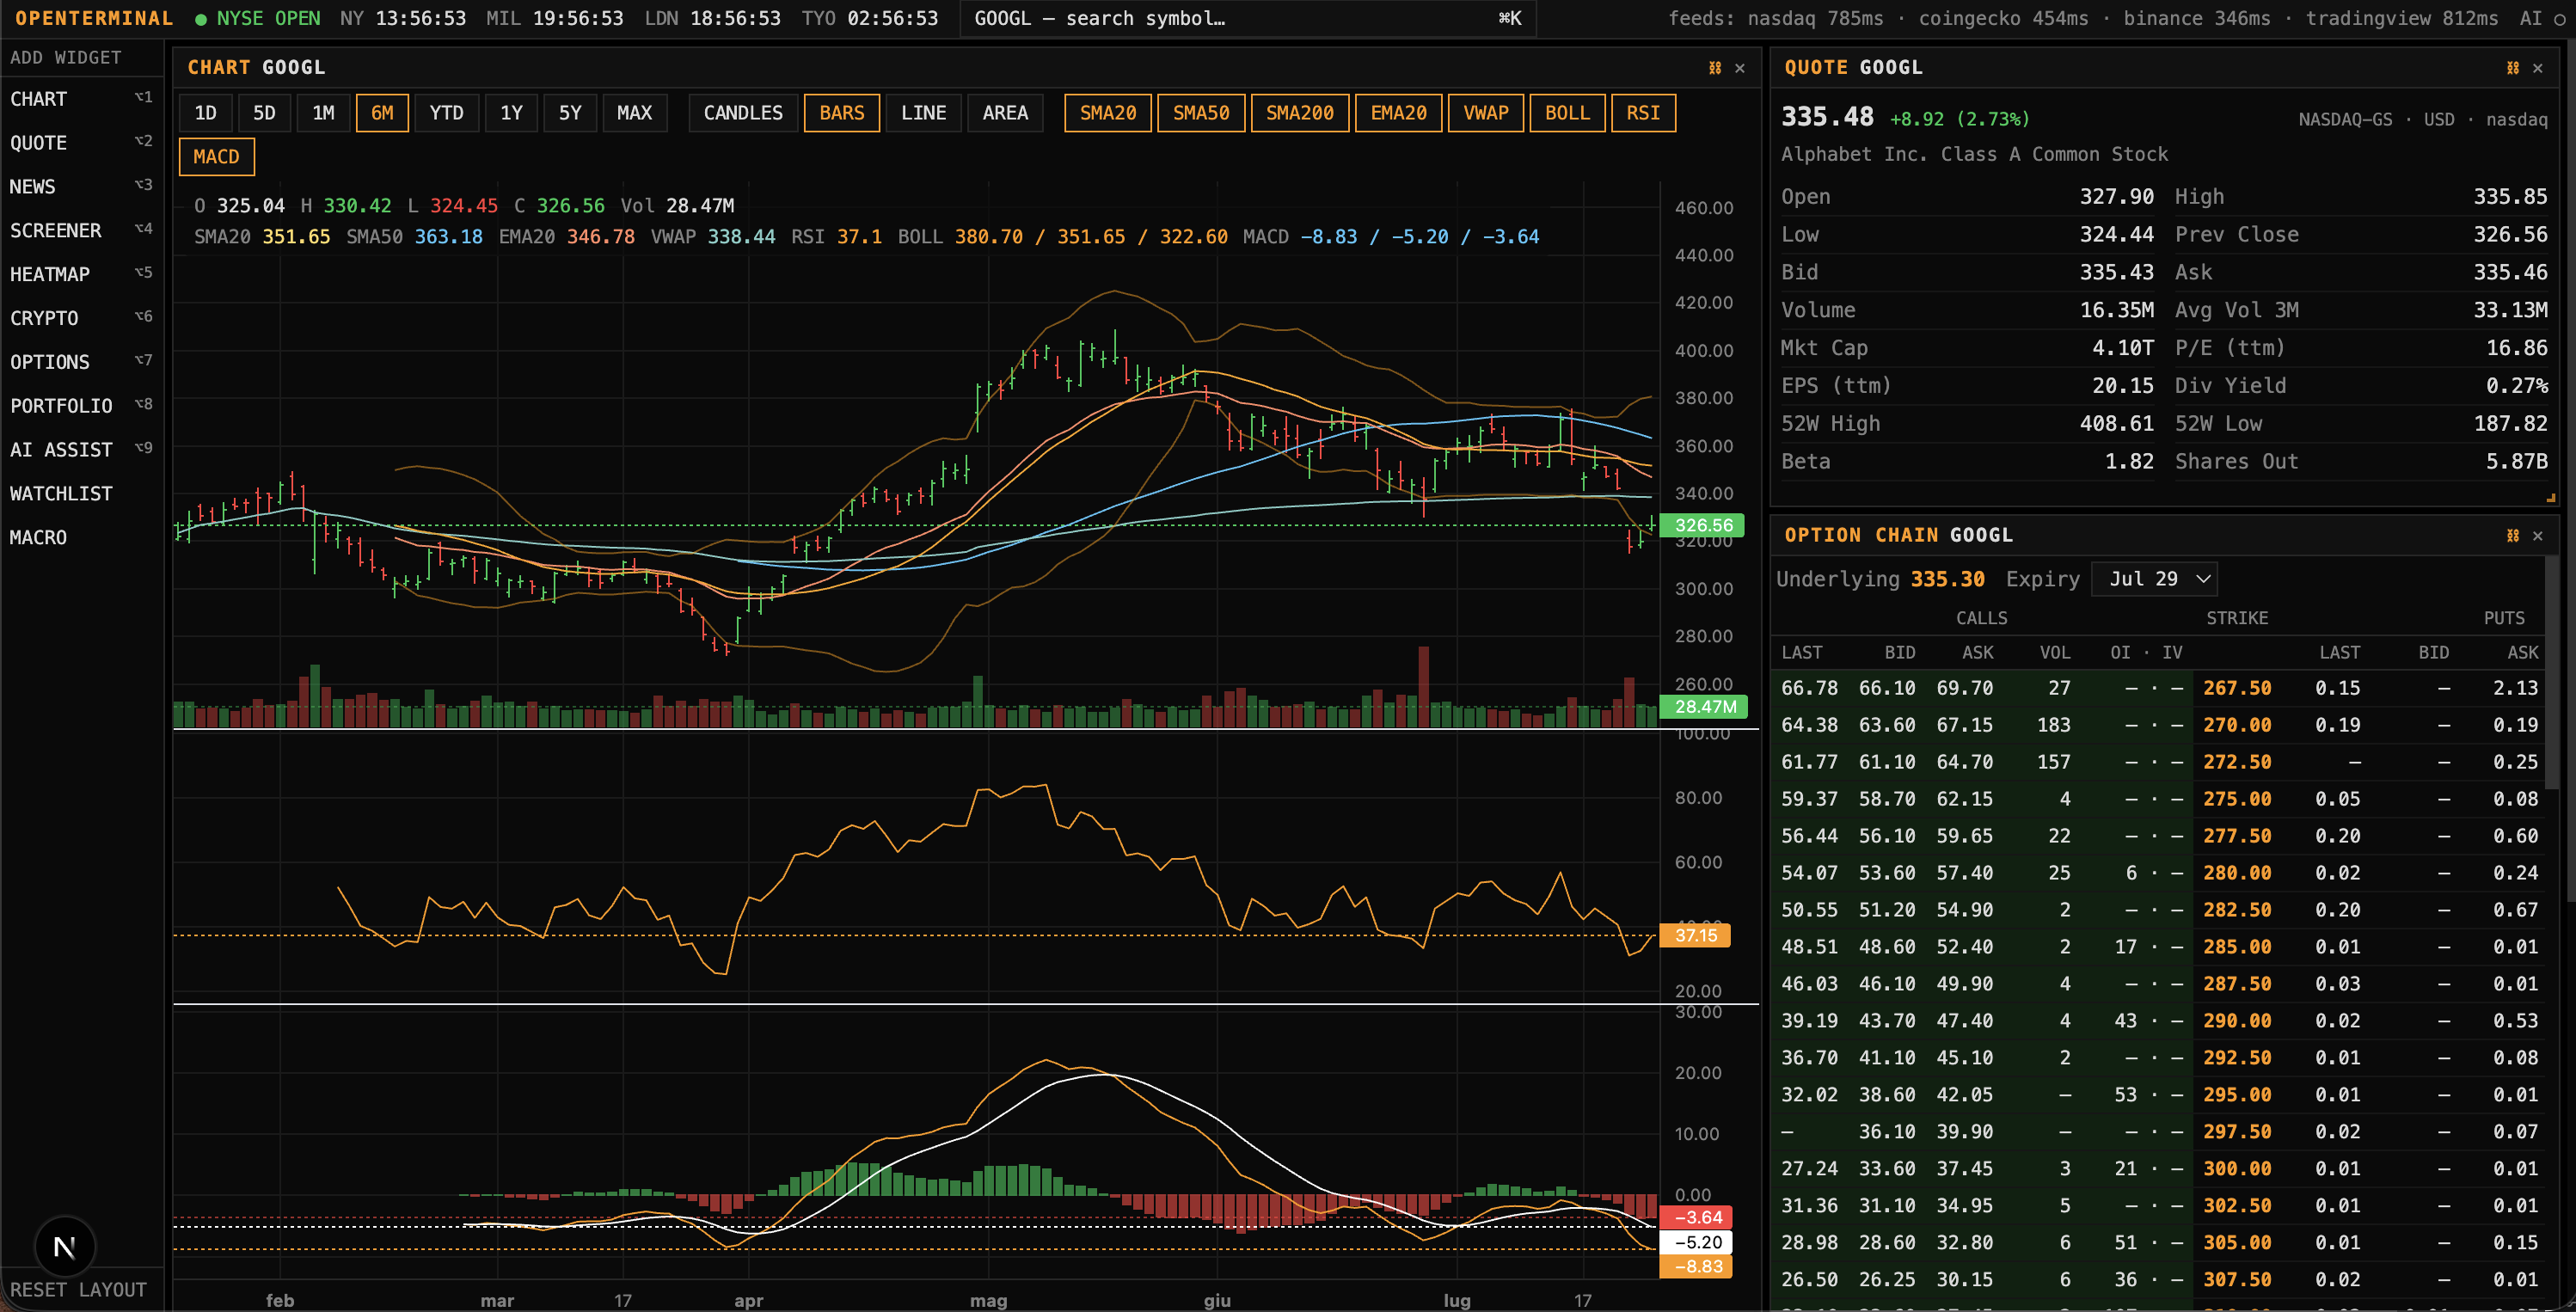
lightweight-charts) — candlesticks, bars, line, area, volume, 8 timeframes (1D → MAX), and SMA / EMA / VWAP / Bollinger Bands / RSI / MACD indicators, each with a live hover legend showing OHLC, volume, and every active indicator's value under your cursor - 💹 Quote panel — last / bid / ask / OHLC, volume, market cap, P/E, EPS, dividend yield, 52‑week range, beta, shares outstanding
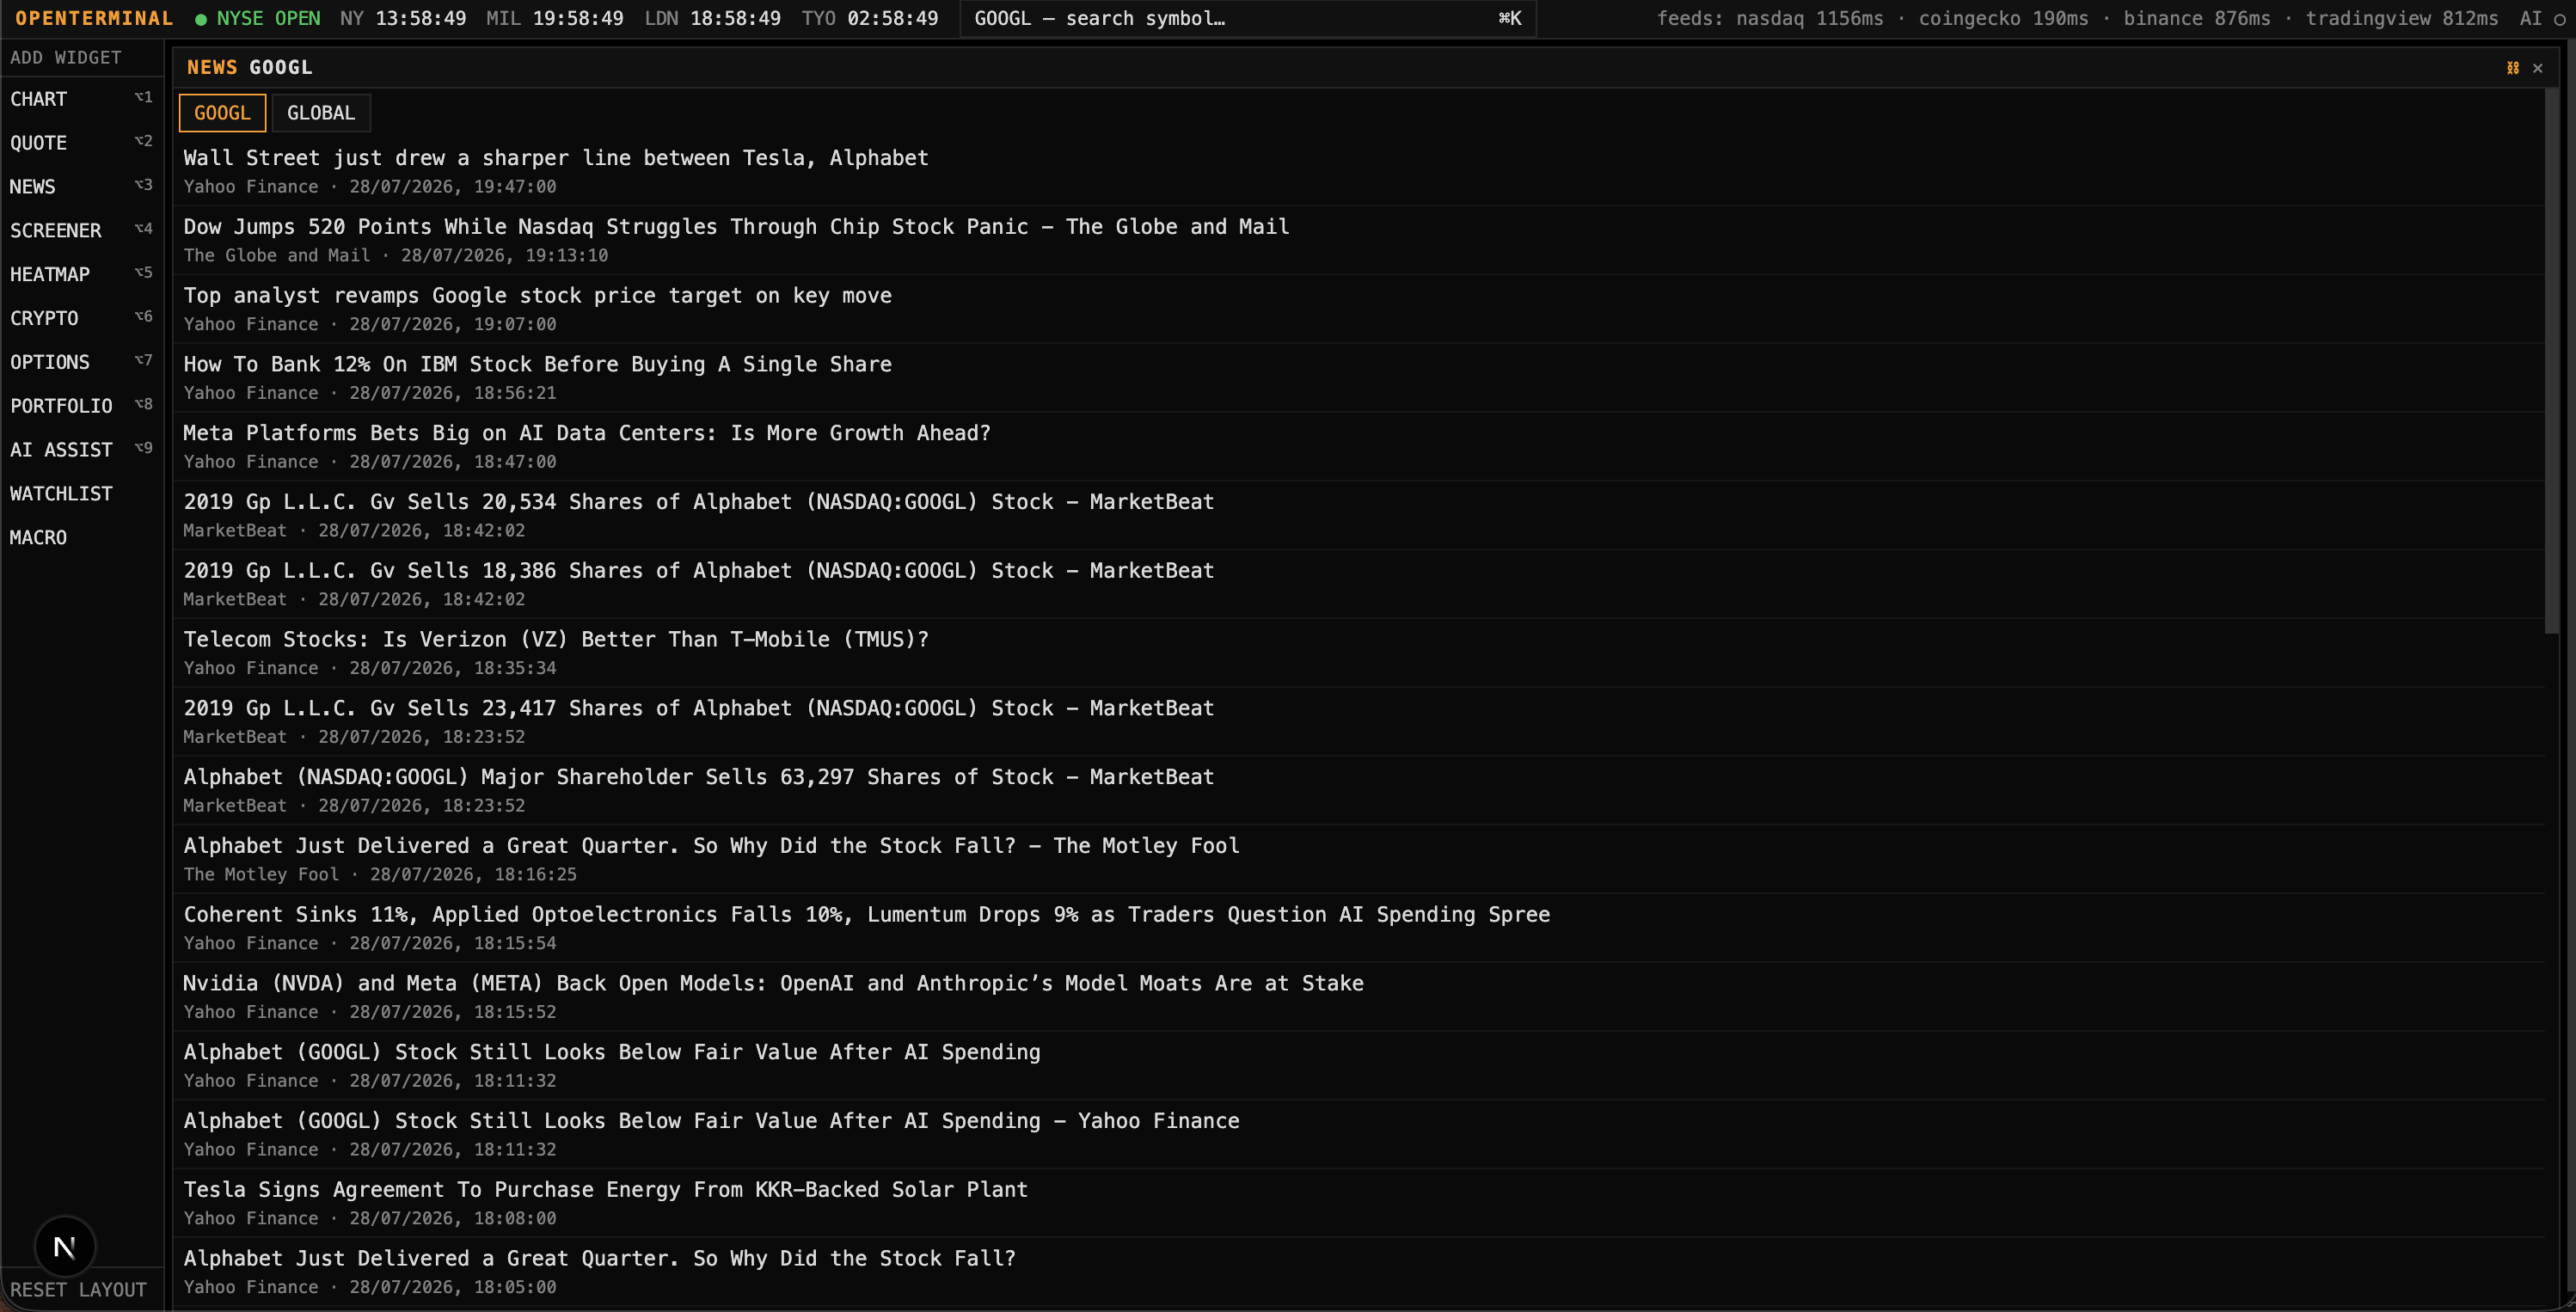
- 📰 News feed — aggregated and de‑duplicated from multiple RSS sources, per‑symbol or global
- 🔎 Full‑market screener — filter by sector, market cap, % change, and volume across the entire US equity market, sortable on every column
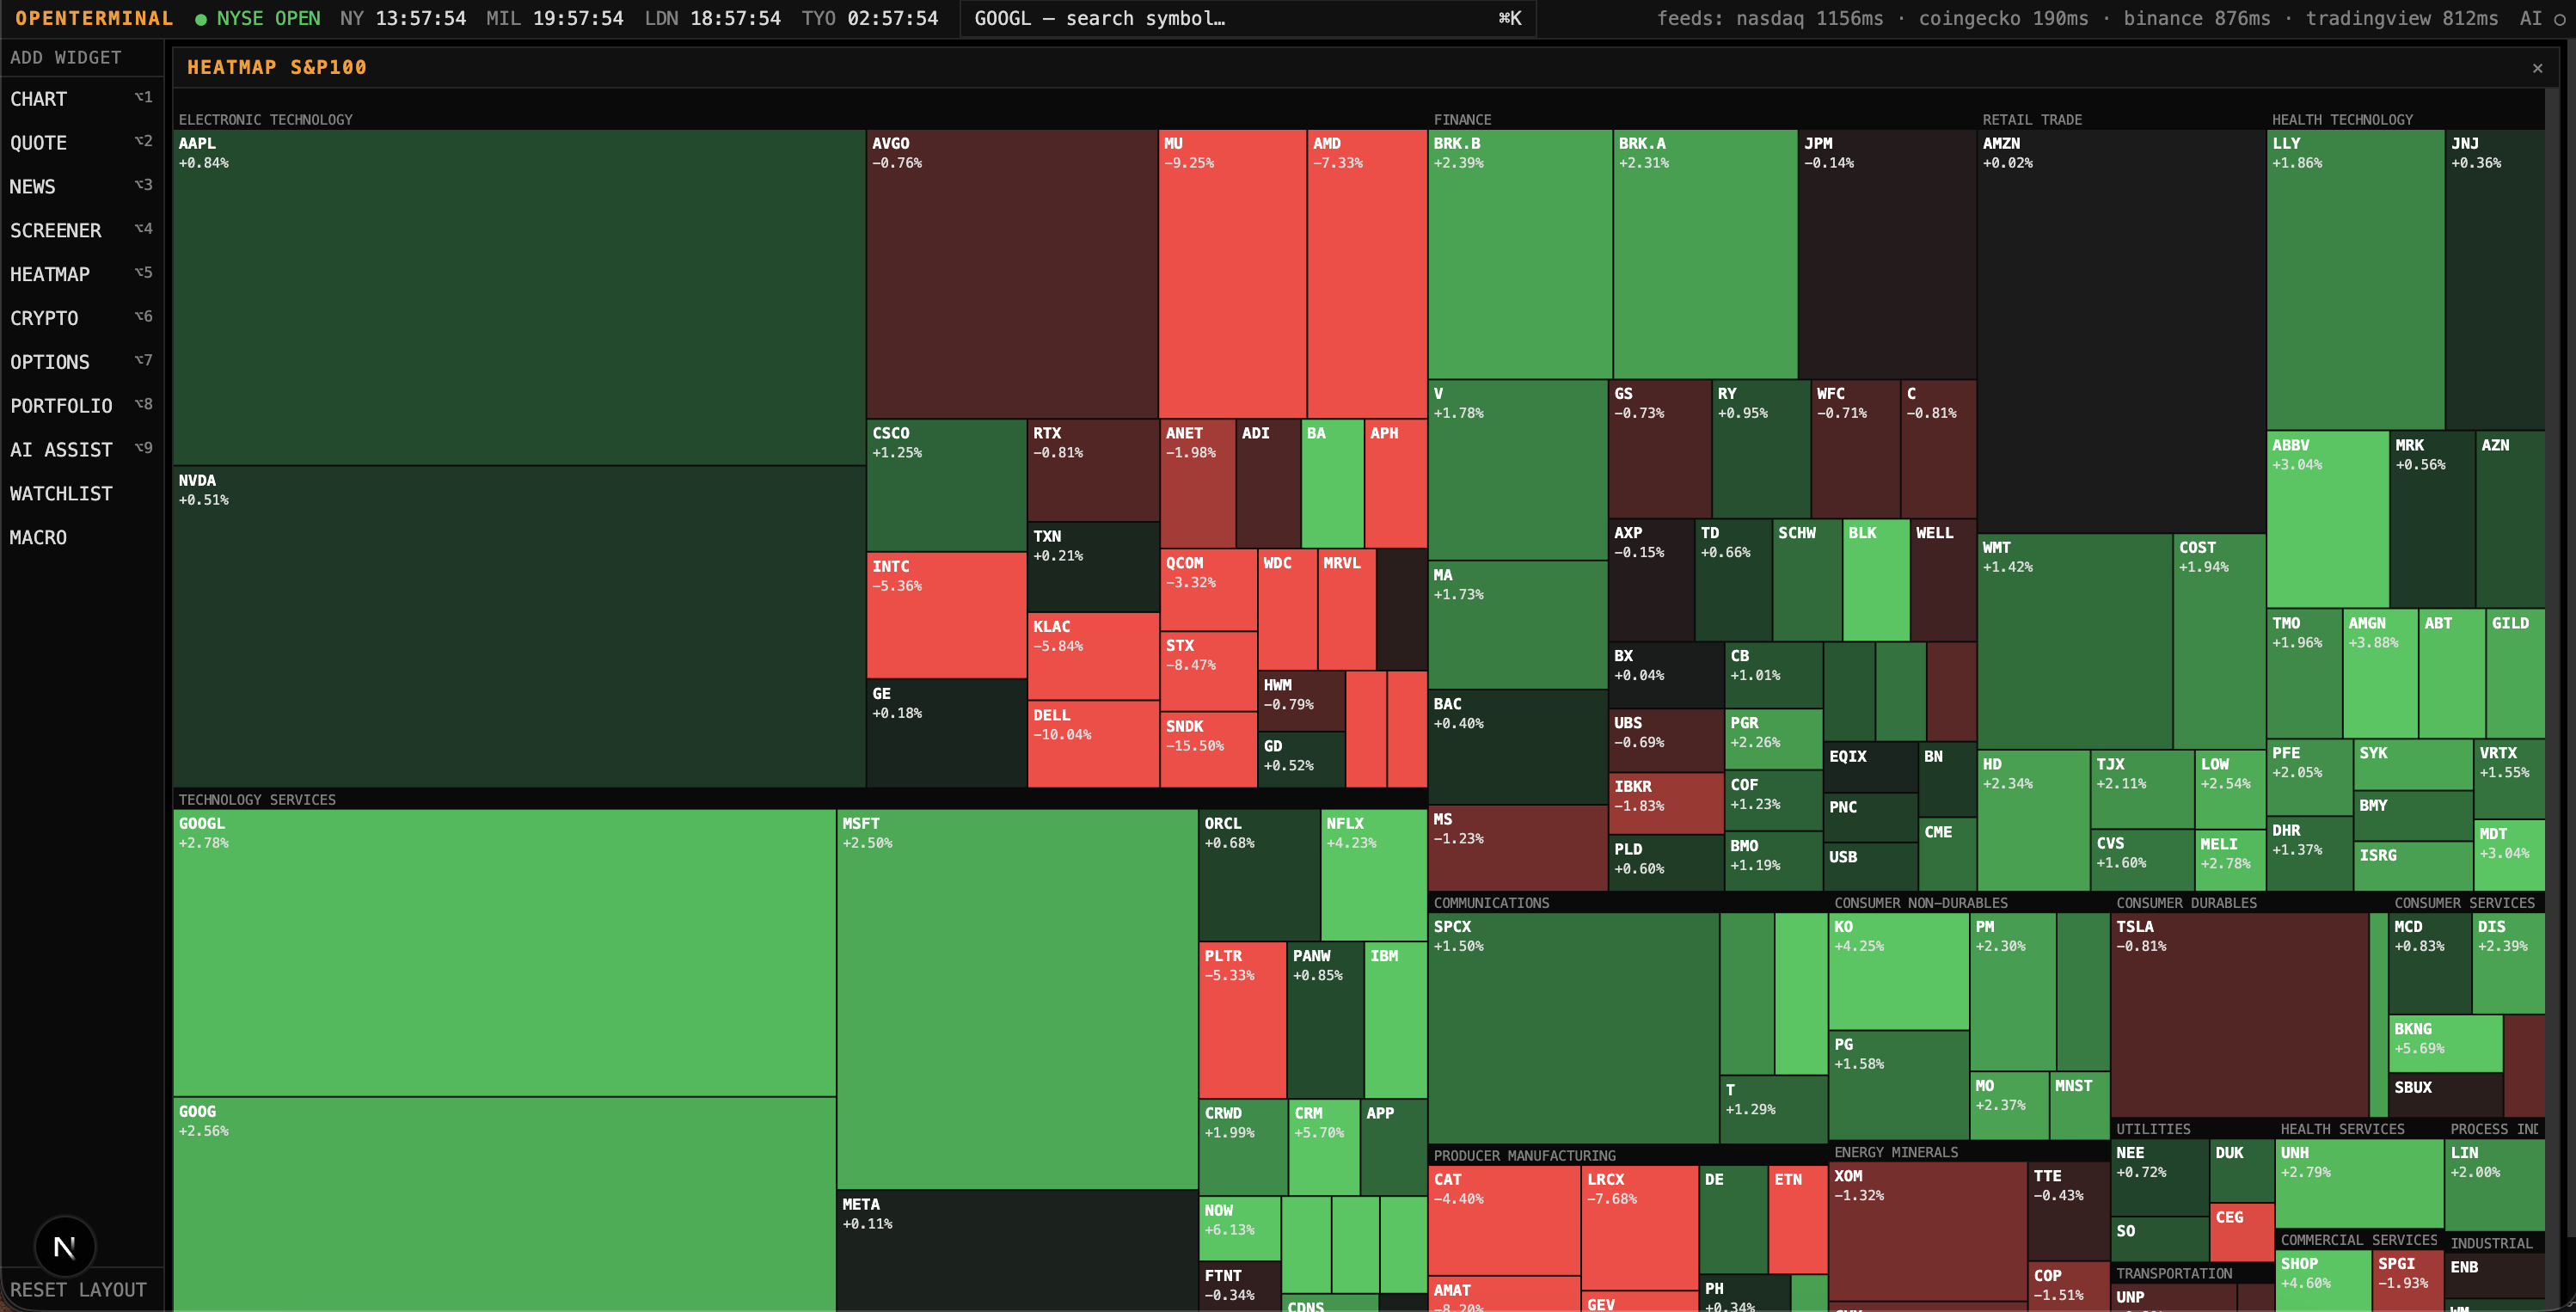
- 🗺️ Live sector heatmap — treemap sized by market cap, colored by daily % change, refreshing every few seconds
- ⛓️ Options chain — calls and puts side‑by‑side with strike, bid/ask, volume, open interest, and ITM highlighting
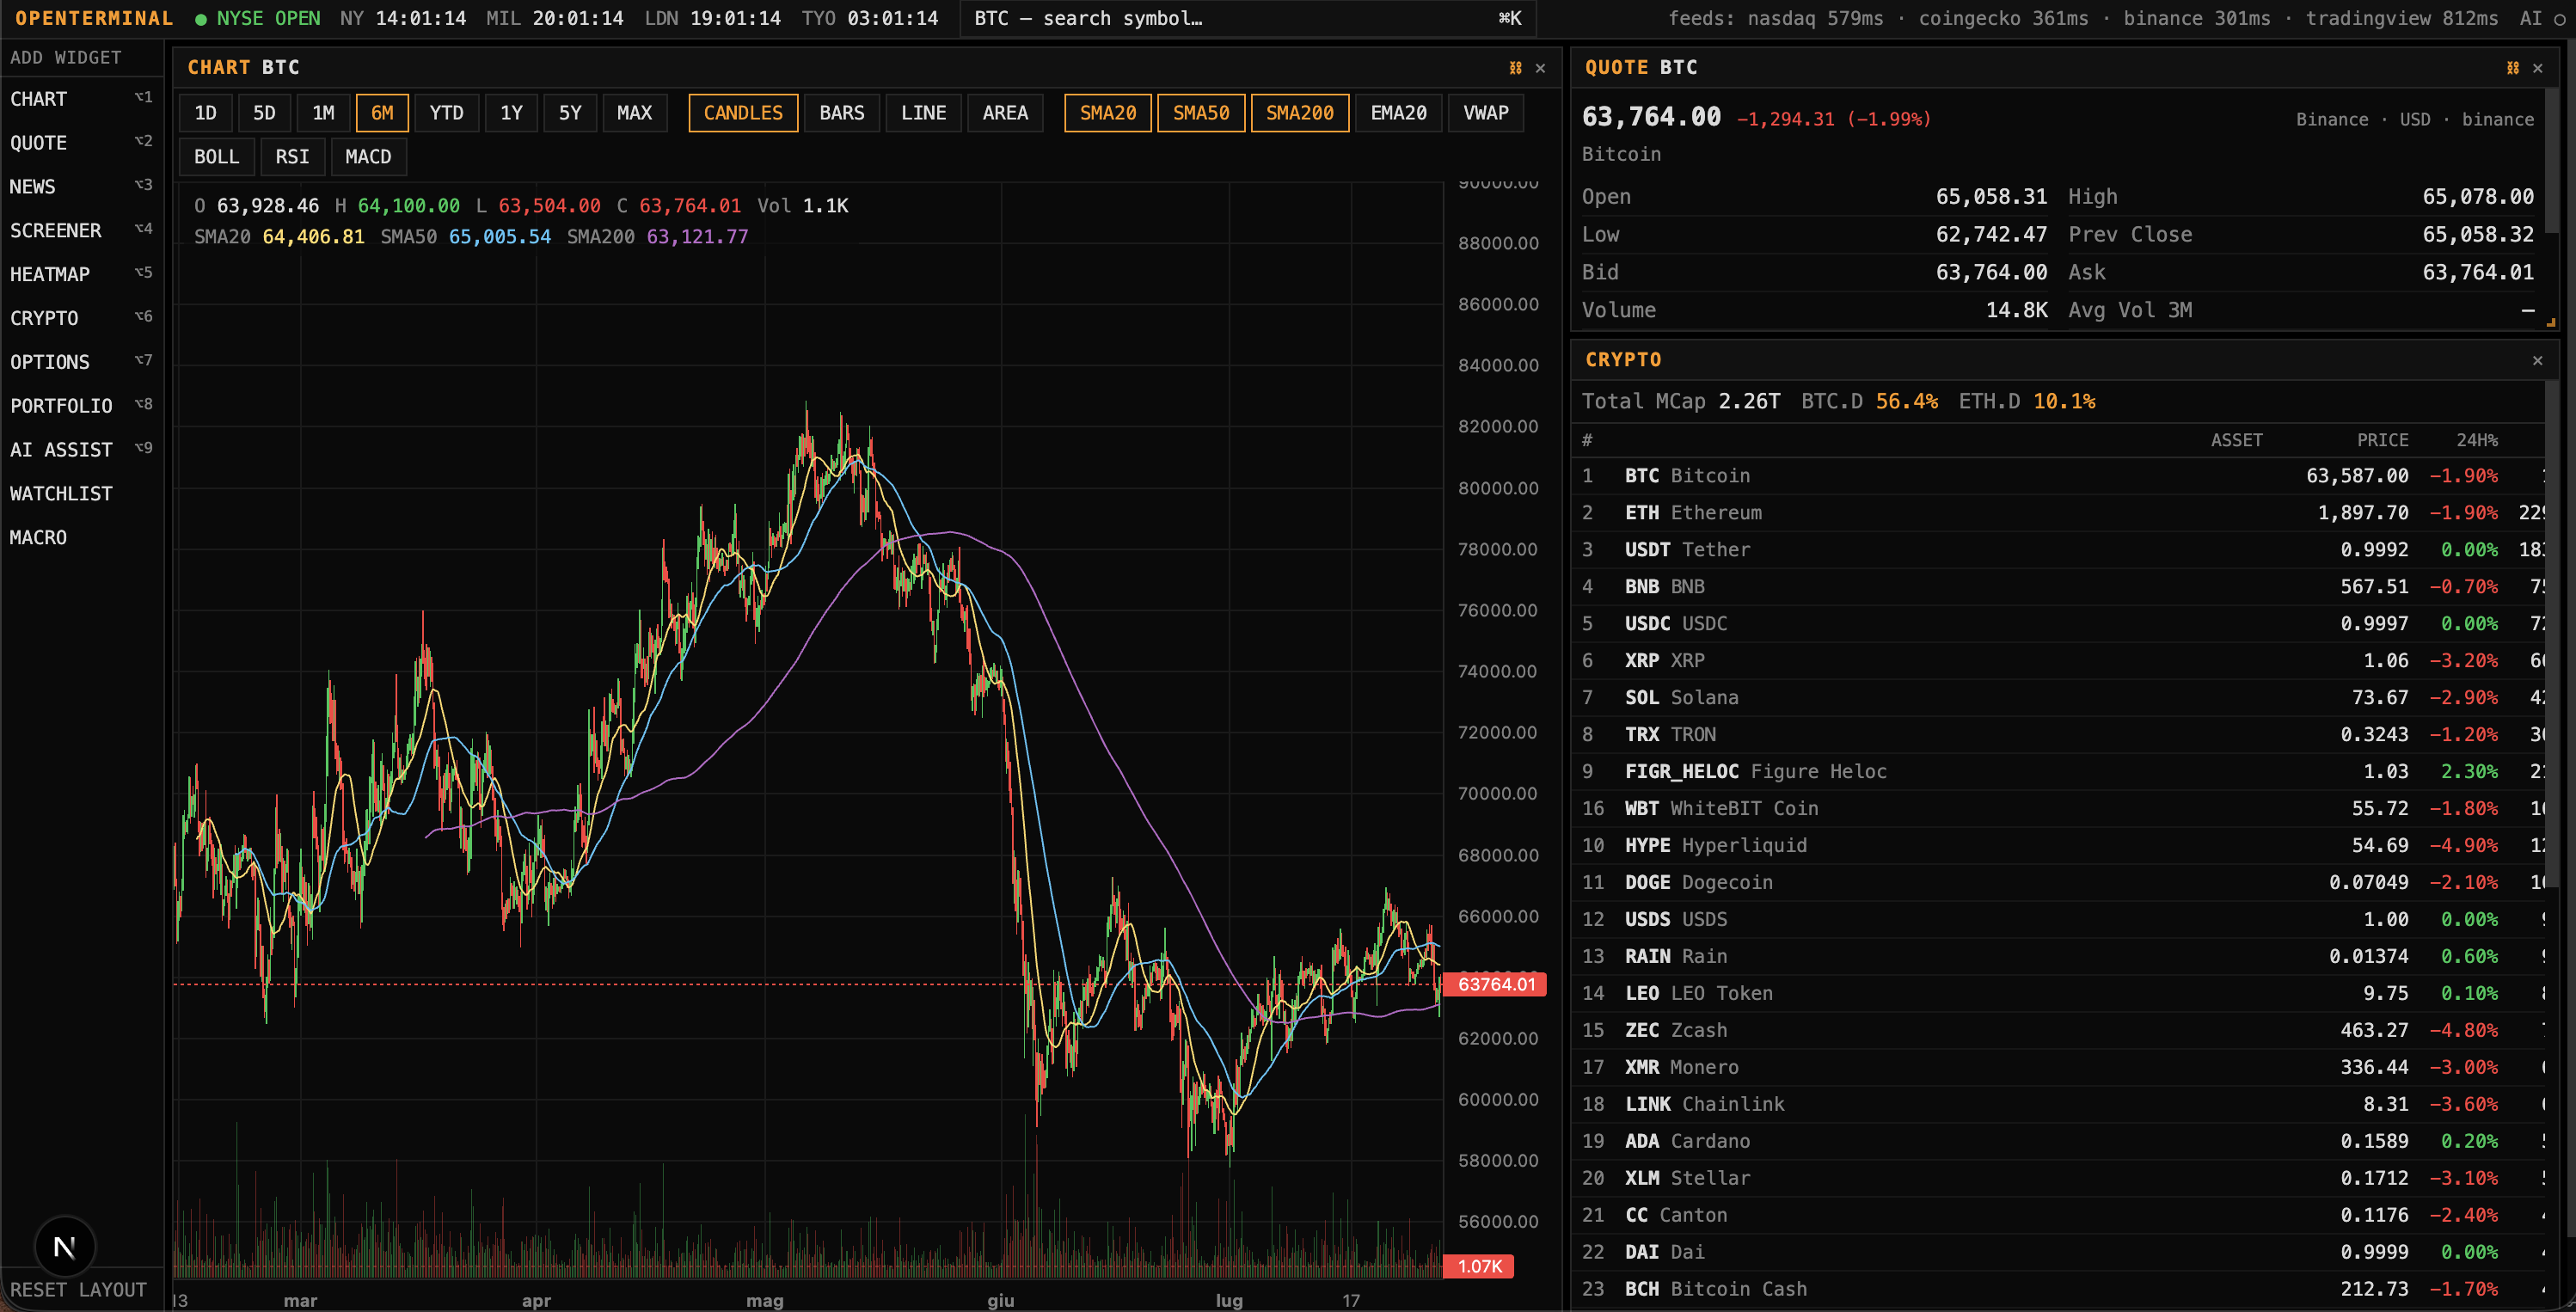
- 🪙 Crypto board — top assets with 7‑day sparklines, BTC/ETH dominance, and full OHLCV charting for any listed coin
- 🏦 Macro dashboard — live US Treasury yield curve, VIX, and major index/commodity proxies
- 💼 Portfolio tracker — log buy/sell transactions, track average cost, realized & unrealized P&L (persisted in SQLite)
- 📅 Calendar — economic events (Fed, ECB, CPI, NFP and more) with consensus forecast, previous reading and, for the major US/EU releases, the actual outcome; plus a per‑watchlist earnings calendar with click‑through history showing forecast vs. actual EPS for the last several quarters and the stock's next‑day price move
- 🤖 AI assistant (optional) — ask questions about the symbol you're looking at, powered by Claude, fully context‑aware of the terminal's current data
- ⚡ Near real‑time updates — quotes and indexes refresh every second with a subtle flash on change, so you always know what just moved
- ⌨️ Keyboard shortcuts everywhere —
⌘Kto search,⌥1–⌥9to add any widget
📸 A closer look
Charting
Candlesticks, bars, line, or area — 8 timeframes, six technical indicators, and a live legend under your cursor showing OHLC, volume, and every active indicator's value for the candle you're pointing at.
Live sector heatmap
The whole US equity market as a treemap — sized by market cap, colored by daily % change, refreshing every few seconds so nothing you're watching ever goes stale.
Crypto
Top assets with 7‑day sparklines and BTC/ETH dominance — click through to full OHLCV candlestick charting for any listed coin, same charting engine as stocks.
News
Headlines aggregated and de‑duplicated across multiple sources, filterable per‑symbol or global, so you're never digging through five tabs to catch up.
🗂️ Data sources
No paid API, no keys, and no single point of failure — every endpoint has a fallback chain, and results are cached with a stale‑while‑revalidate strategy so a temporary outage never blanks out the UI.
| Data | Primary source | Fallback |
|---|---|---|
| Quotes (stocks/ETFs) | Nasdaq public quote API | Yahoo Finance → Stooq |
| Fundamentals (P/E, EPS, beta, div yield) | TradingView scanner API | — |
| Historical candles | Nasdaq chart API | Yahoo Finance → Stooq |
| Symbol search | TradingView symbol search | Yahoo Finance |
| Full‑market screener / heatmap | TradingView scanner API (live, whole US market) | — |
| Options chain | Nasdaq option‑chain API | Yahoo Finance |
| News | Yahoo Finance RSS | Google News RSS |
| Crypto quotes & board | CoinGecko | Binance public API |
| Crypto candles | Binance public API (klines) | — |
| Macro (Treasury yields, VIX) | FRED (Federal Reserve) | — |
| Economic calendar (schedule, forecast, previous) | Forex Factory public feed | — |
| Economic calendar (actual — Fed / ECB / CPI / NFP only) | FRED (Federal Reserve) | — |
| Earnings calendar (next/last date, EPS estimate) | TradingView scanner API | — |
| Earnings history (forecast vs. actual, surprise %) | Nasdaq earnings‑surprise API | — |
⚠️ These are public endpoints, not officially licensed data feeds — treat prices as delayed/indicative, not execution‑grade. See
server/src/providers/— each provider is a small, isolated module, so swapping or adding a data source is a 30‑minute job.
🚀 Quick start
git clone https://github.com/ErTasselli/openterminal.git
cd openterminal
npm install
npm run dev- Web UI → http://localhost:3000
- API health → http://localhost:4000/api/status
That's it — no .env file required to get a fully working terminal.
Optional: AI assistant
export ANTHROPIC_API_KEY=sk-ant-...
npm run dev
Without a key, everything else still works — the AI widget just shows a friendly "unavailable" message instead of failing.
Security defaults
- The API binds to
127.0.0.1and only accepts browser requests fromhttp://localhost:3000by default — nothing else on your network can reach it out of the box. - The portfolio and AI endpoints require a shared secret. If you don't set
API_KEYyourself, the API generates one on first run and saves it todata/.api-key; the bundled web app reads that file automatically, so local dev stays zero-config. - To expose this beyond your own machine, set
API_HOST=0.0.0.0,API_KEY=<a-strong-secret>(on both the api and web processes), andWEB_ORIGIN=<your actual origin>explicitly. Don't do this without also keeping dependencies patched — see Known limitations below. - The
/api/airate limit (10 req/min) keys onreq.ip. Calls made through the bundled web proxy all arrive from that proxy's own address, so by default every caller sharing it shares one bucket. If you're serving more than one real user through it, setTRUST_PROXY=1on the api process only if you also run your own reverse proxy in front of the web service that setsX-Forwarded-Forfrom the real client and doesn't let visitors set it themselves — otherwise a caller can forge that header to dodge the limit.
🐳 Docker
docker compose up --buildPortfolio data persists in the terminal-data volume (SQLite, WAL mode). Ports are published on 127.0.0.1 only by default; see Security defaults to expose it deliberately.
🧱 Tech stack
| Layer | Stack |
|---|---|
| Frontend | Next.js 15 · React 19 · TypeScript · Tailwind CSS 4 · Zustand · TanStack Query |
| Charts | lightweight-charts (candles/indicators) · D3 (heatmap treemap) · Recharts (yield curve) |
| Backend | Node.js · Express · TypeScript |
| Database | SQLite (better-sqlite3, WAL mode) |
| AI | Anthropic Claude (optional) |
📁 Project structure
├── server/                  # Express + TypeScript API
│   └── src/
│       ├── providers/       # nasdaq, tradingview, yahoo, stooq, fred, econcalendar, coingecko, binance, news
│       ├── routes/          # market, portfolio, ai
│       ├── cache.ts         # TTL cache with stale-while-revalidate fallback
│       └── db.ts            # SQLite (better-sqlite3, WAL)
└── web/                      # Next.js 15 + React 19 + Tailwind 4
    ├── components/           # TopBar, Sidebar, Workspace, CommandPalette
    ├── components/widgets/   # Chart, Quote, Watchlist, News, Screener, Heatmap, Crypto, Options, Macro, Portfolio, Calendar, AI
    ├── lib/                  # API client, technical indicators
    └── store/                # Zustand store (workspace layout, persisted)
Run tests with npm test (Vitest, no network calls). CI runs on every push — see .github/workflows/ci.yml.
🗺️ Roadmap
- Chart drawing tools & multi‑asset comparison overlay
- Black‑Scholes Greeks on the options chain
- Price alerts with desktop notifications
- PostgreSQL as an alternative to SQLite
Have an idea? Open an issue — contributions are very welcome.
🤝 Contributing
Pull requests are welcome, especially:
- New or more resilient data providers (
server/src/providers/) - New widgets (
web/components/widgets/) - Bug fixes and UI polish
Please open an issue first for anything non‑trivial so we can align on approach before you invest the time.
Known limitations
npm auditstill flags two dependency advisories this project doesn't force-fix:fast-xml-parser's XMLBuilder injection (moderate) doesn't apply here — onlyXMLParseris used, neverXMLBuilder— andpostcss's high-severity issue is bundled inside Next.js itself, only resolved by a Next 16 major upgrade. Both are tracked, neither is silently ignored.- If you deploy behind a reverse proxy or load balancer, set
API_HOST/WEB_ORIGINto match, and terminate TLS in front of it — this project doesn't handle HTTPS itself.
⚖️ Disclaimer
For personal and educational use only. Market data comes from public endpoints and may be delayed, incomplete, or occasionally wrong — do not use this for real investment decisions.
This project is not affiliated with, endorsed by, or sponsored by any of the data providers it connects to. It does not host or redistribute data to third parties — it's source code you run yourself, fetching data directly from the provider. Respect the terms of service of the underlying data providers; most free sources are licensed for personal/research use only and prohibit commercial redistribution.
License
star the repo ⭐ — it's the best way to support the project.