Describe a network in plain words. Your AI plans it, validates it, and builds it live in Cisco Packet Tracer — then pings it to prove it works.
New — PKA Builder: CCNA instructors and students turn one sentence into a custom, graded Packet Tracer exam (.pka).
Install it by asking your agent: "Install the Packet Tracer MCP from github.com/Mats2208/MCP-Packet-Tracer and set everything up for me."






| 111 MCP tools | 6 MCP resources | 3 MCP prompts | 74 device models | 150 modules | 15 cable types | 13 activity tools | 1,697 offline tests |
Video • PKA Builder • What it can do • Install • Quick start • Docs
Video

▶ Watch on YouTube (6 min): install, how it works, and three live examples. Spanish narration, English subtitles.
Showcase
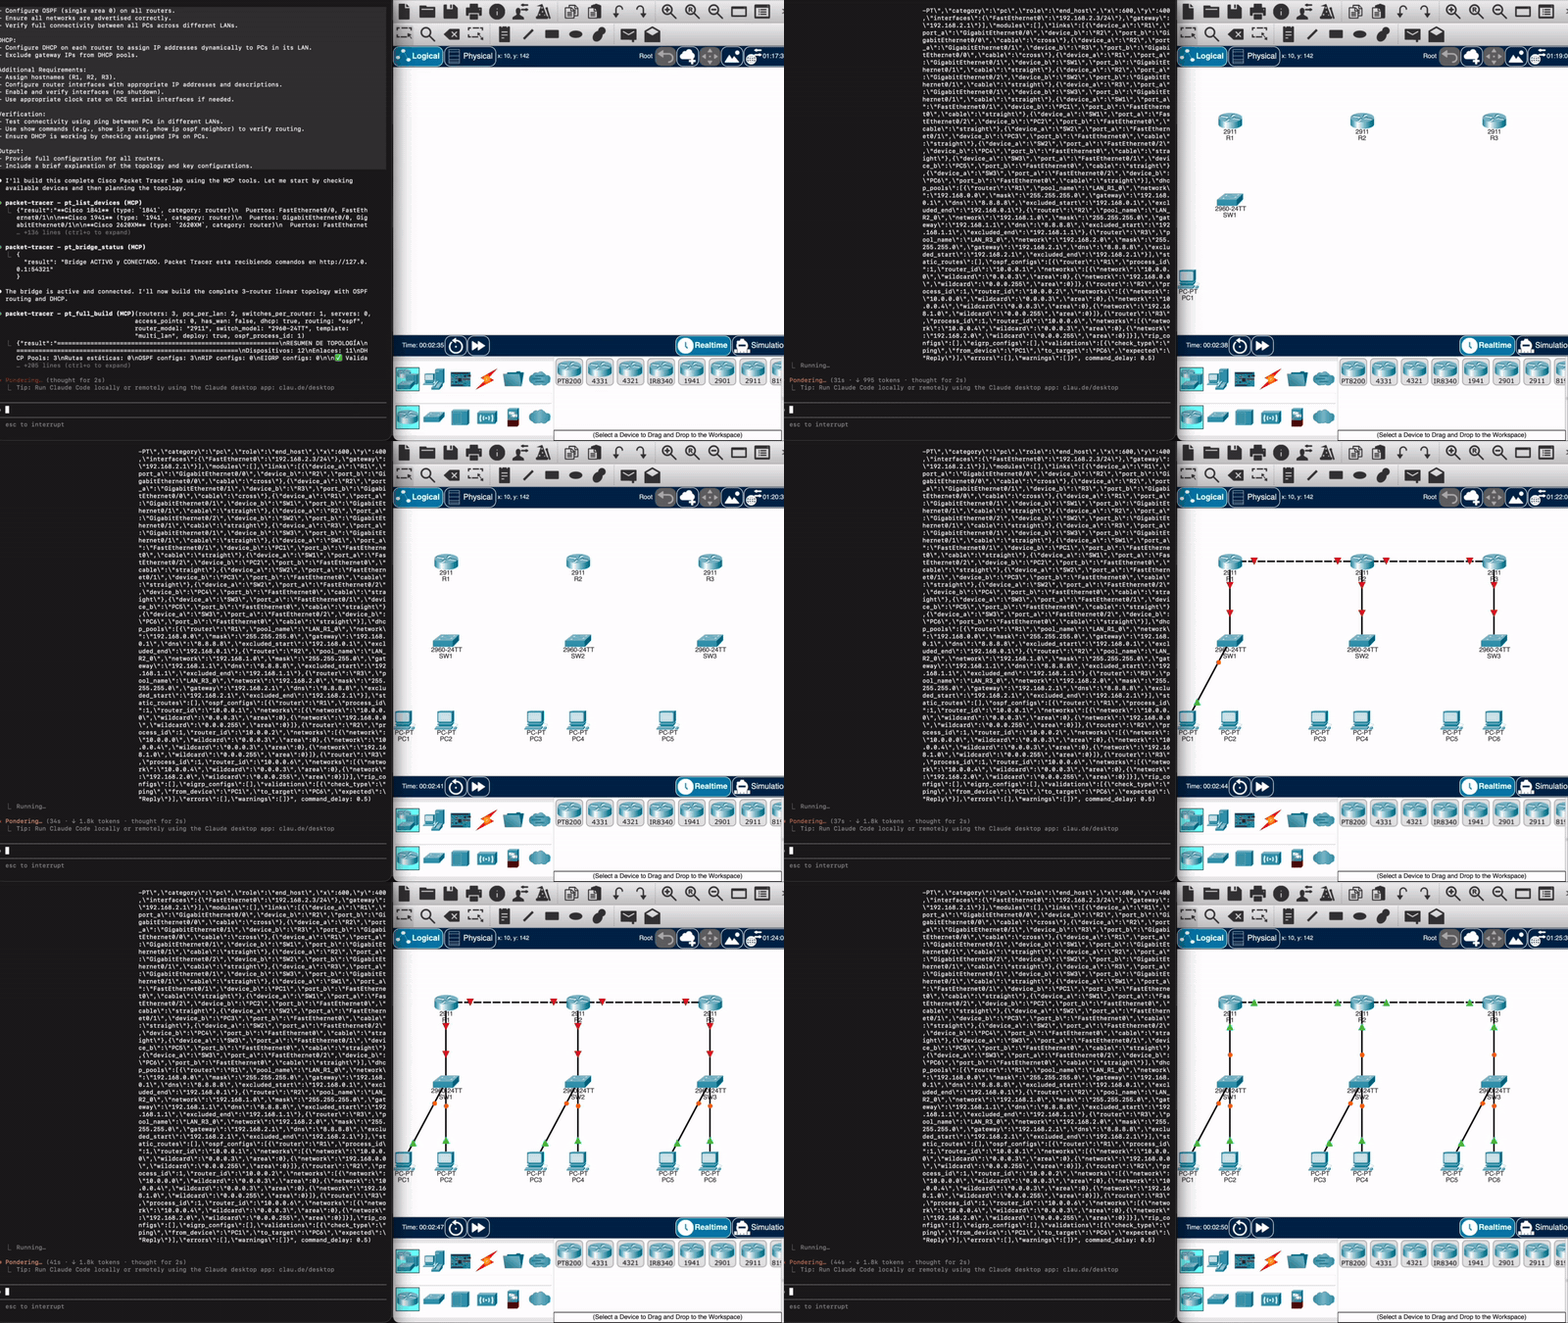
From a prompt to a running topology in Packet Tracer, in real time
|
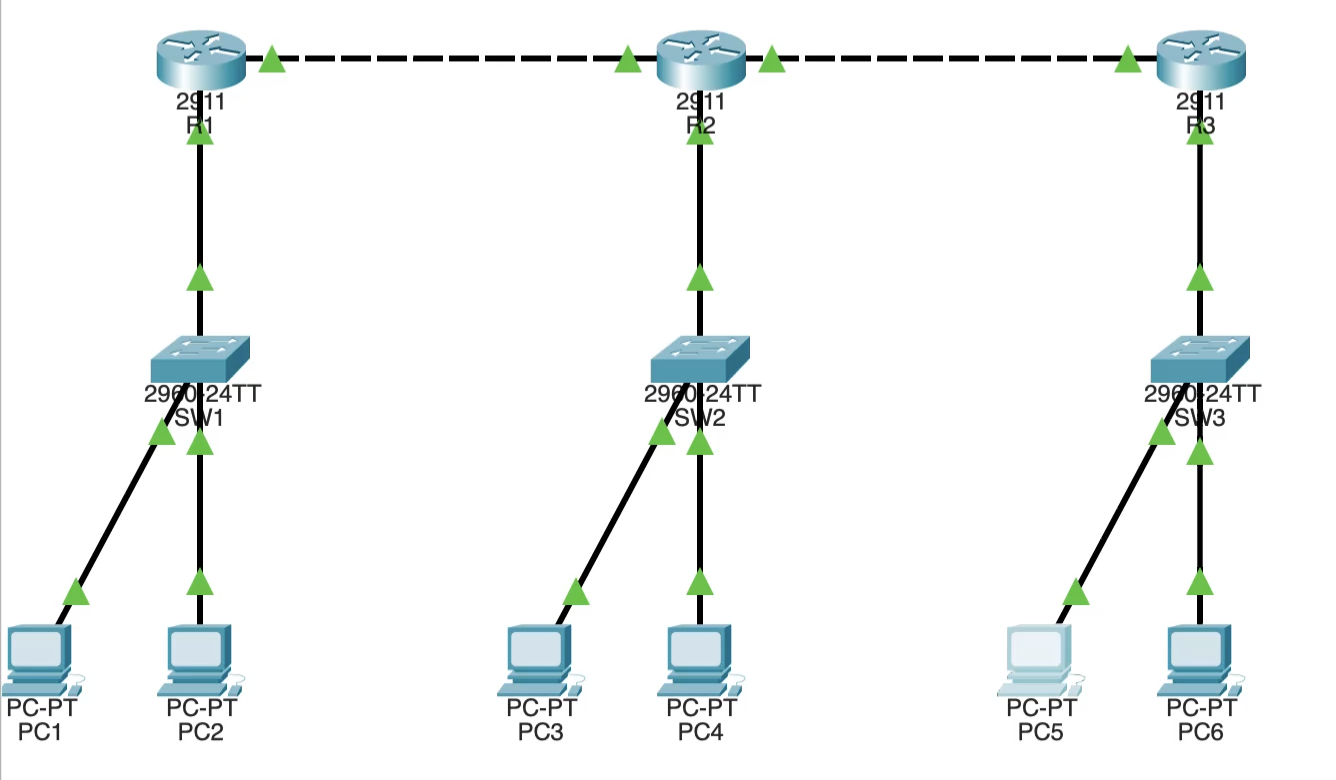
3 routers, OSPF, DHCP and 6 PCs — planned and deployed by the agent |
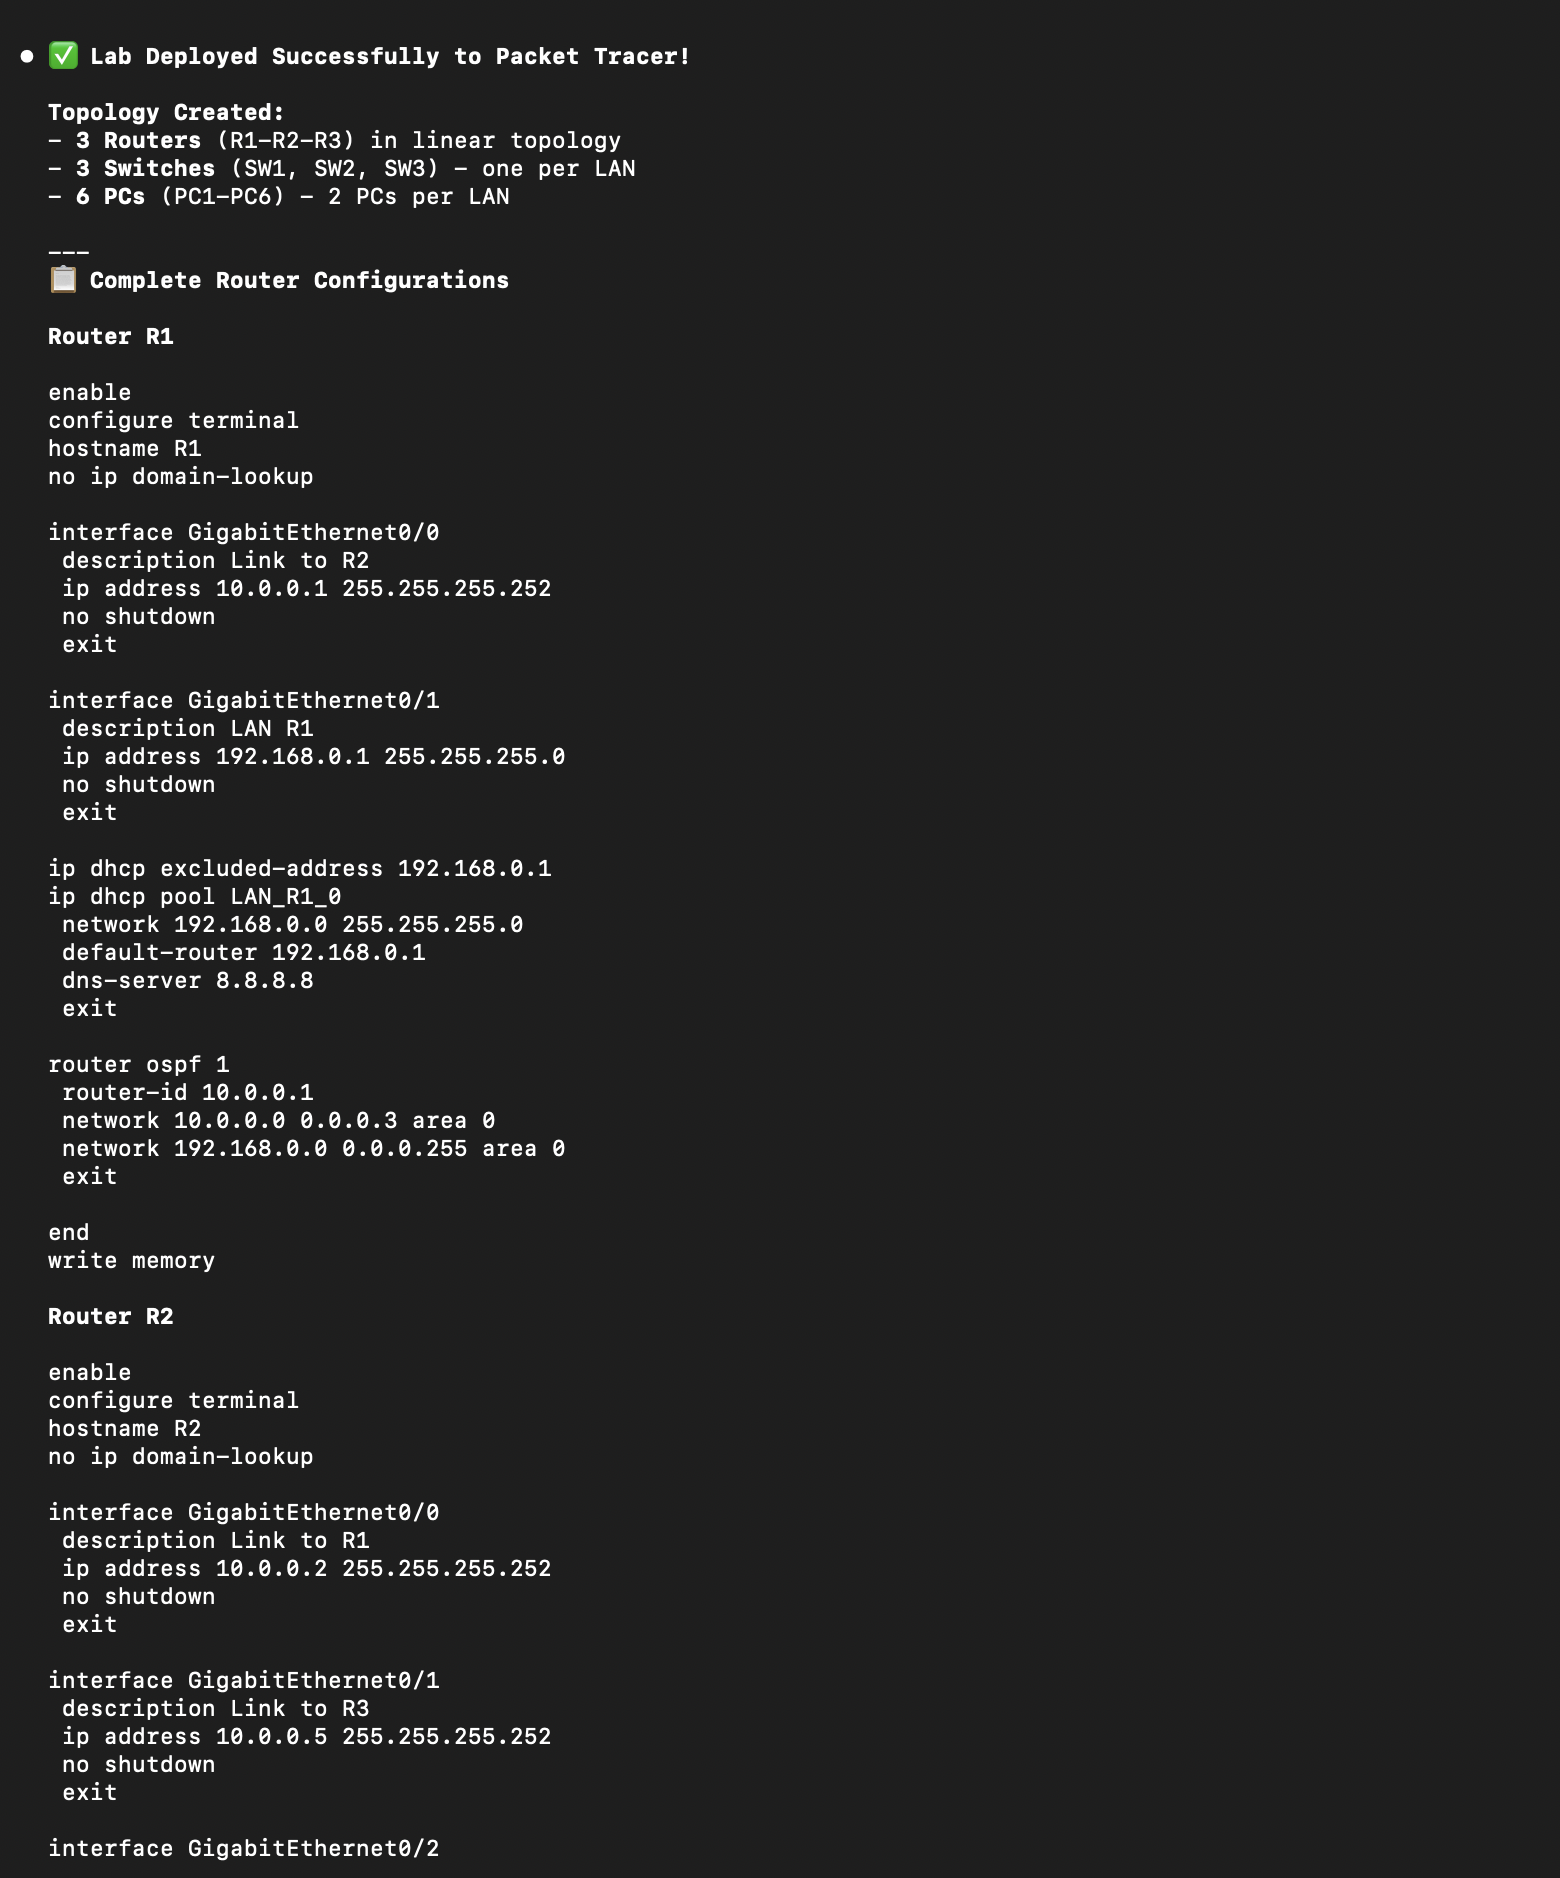
The IOS configuration it generates and applies |
PKA Builder: custom exams for CCNA classes
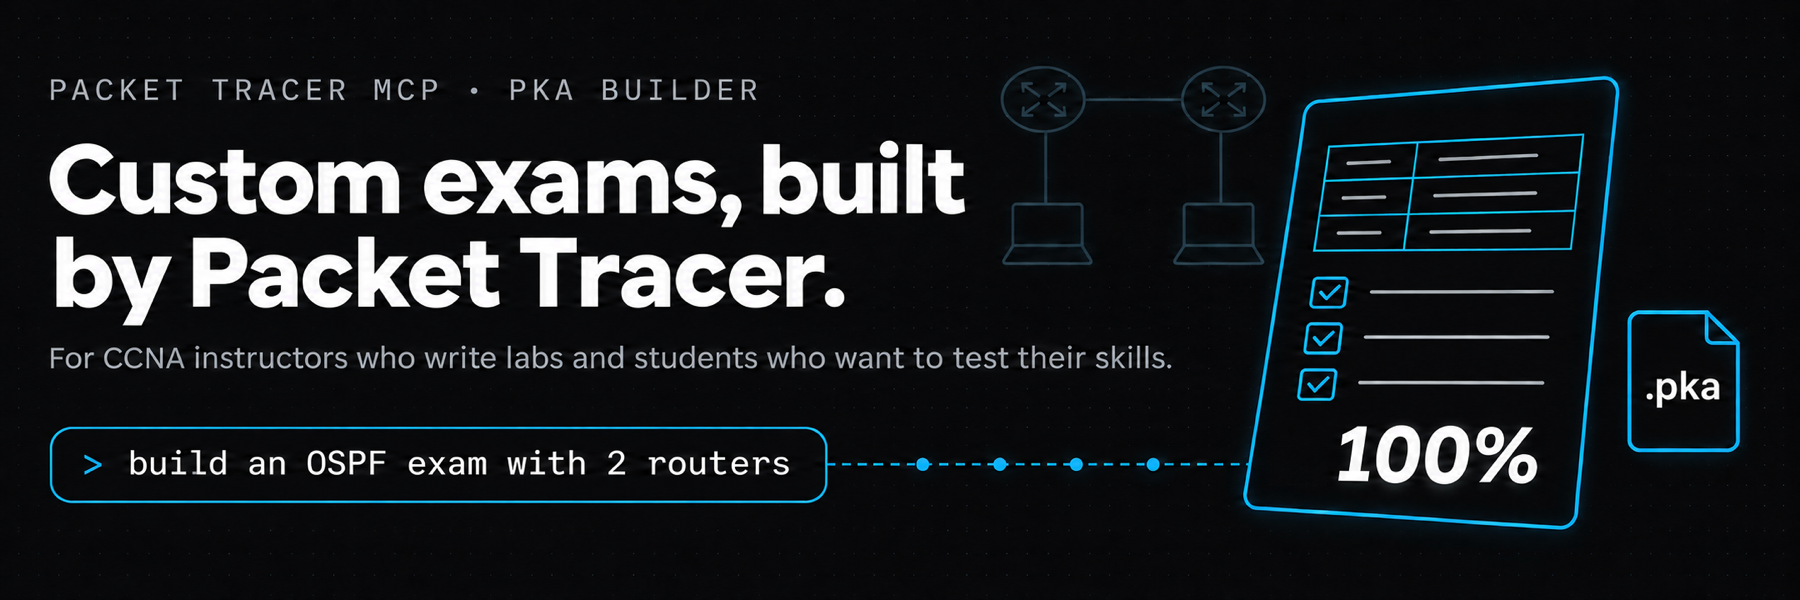
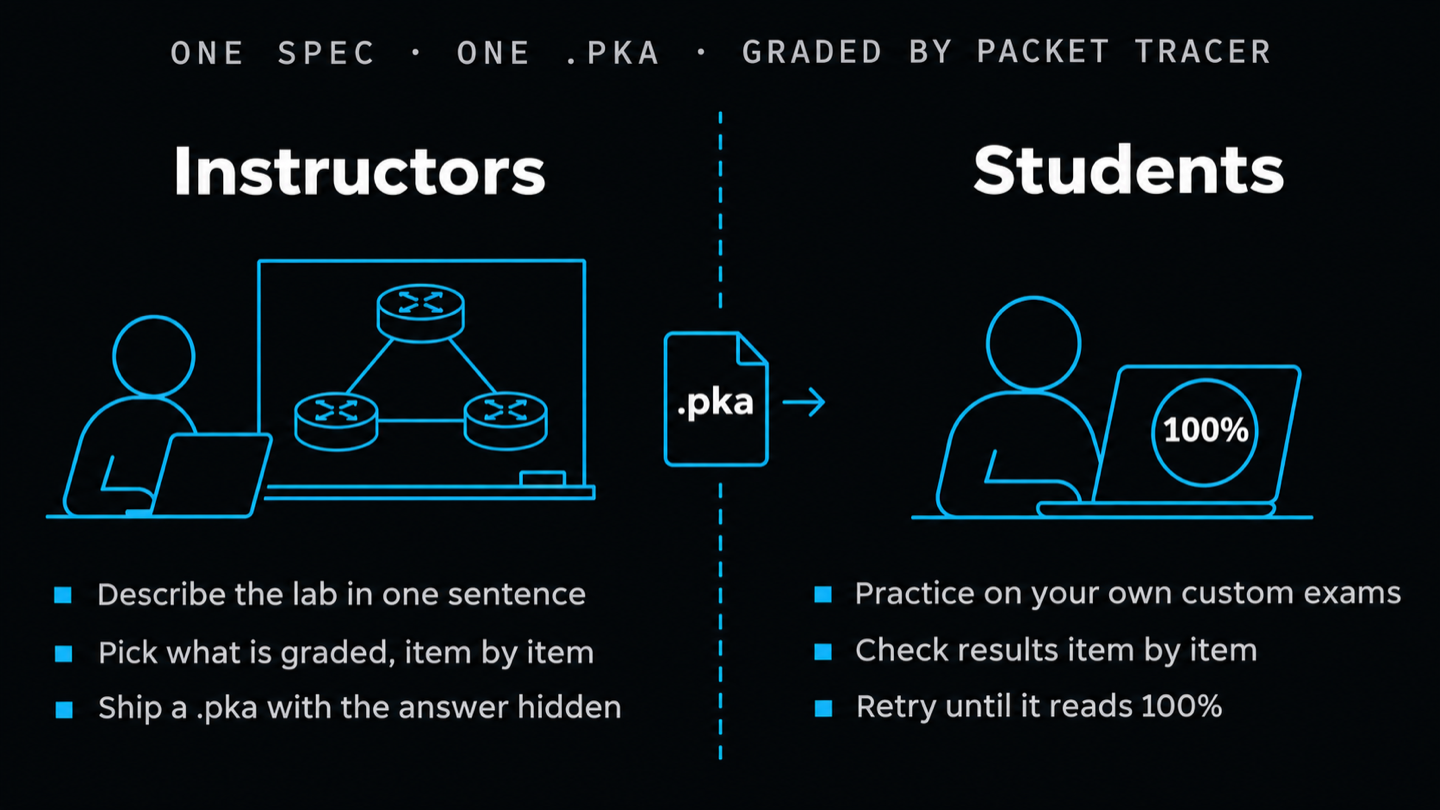
Instructors and students preparing for the CCNA can turn one sentence into a graded Packet Tracer activity.
Describe the lab, and Packet Tracer itself builds the answer network, writes formatted instructions, marks what
is graded, prepares the starting network and saves the .pka. Open it as a student and Check Results grades
it item by item, the same way the activities you already know do.

Animated walkthrough of the flow: one prompt, the 10 build steps, and the exam a student opens and grades
🧑🏫 For instructors
|
🧑🎓 For students
|
Try it
"Build a VLAN exam with one switch and 4 PCs in 2 VLANs, worth 10 points, instructions in Spanish."
"Make me a practice exam on static routing with 3 routers. Don't show me the answer."
"Open ~/Downloads/lab3.pka, check my results and tell me what is still wrong."
Or call the tool with a spec (check it first with dry_run=True):
pt_activity_create_exam(spec={
    "title": "OSPF exam",
    "language": "en",
    "situation": "Configure **R1**.",
    "addressing": [{"device": "R1", "interface": "GigabitEthernet0/0", "ip": "192.168.0.1", "mask": "255.255.255.0"}],
    "requirements": ["Address R1"],
    "items": [["R1", "Ports", "GigabitEthernet0/0", "IP Address"]],
    "plan_path": "plan.json",
    "output_path": "/absolute/path/ospf-exam.pka",
})|
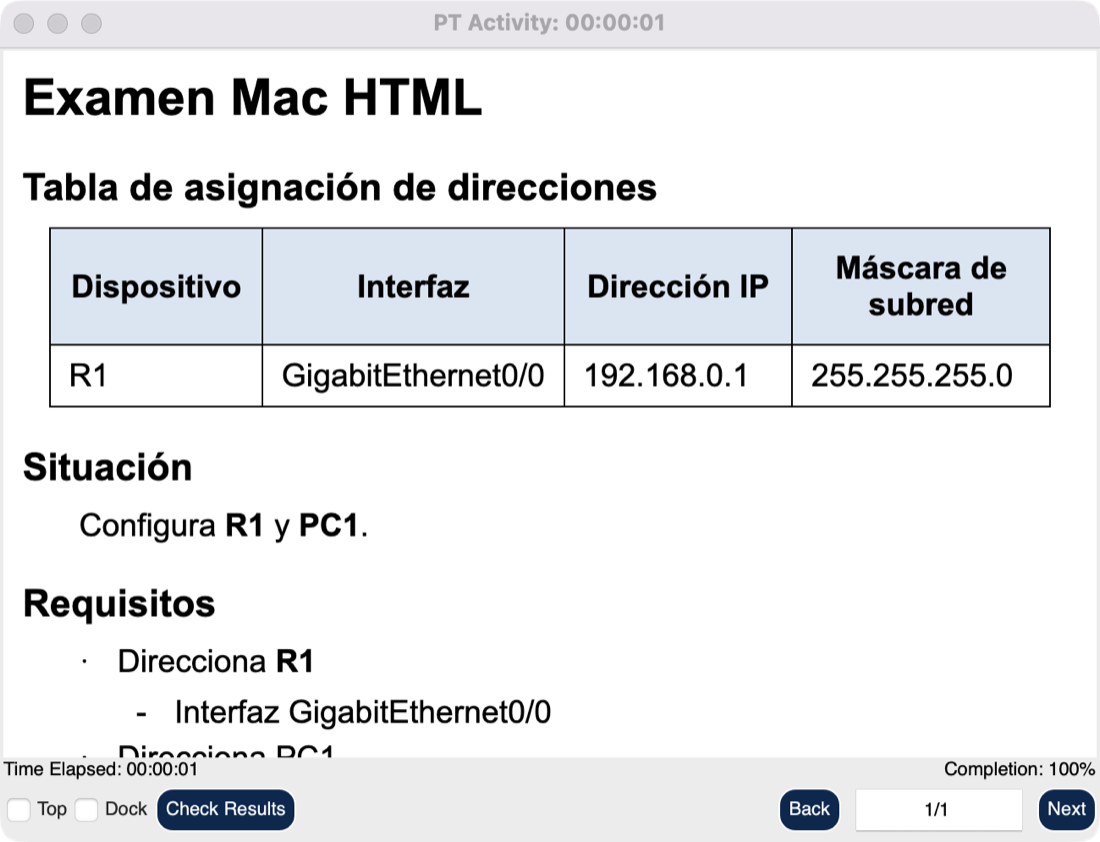
A real generated exam, reopened as a student sees it (macOS, Packet Tracer 9.0.1) |
¹ needs |
How it stays clean. Every .pka is created and saved by your own copy of Packet Tracer: this project never
reads, writes or decrypts the file format. Reading, marking and grading use Packet Tracer's published Extensions
API; activity creation operates the Activity Wizard window the way a person would. The exams are yours, not
Cisco or Networking Academy content. Status, limits and roadmap in PkaIndex, the full
reference in PKA Builder.
How it works
"3 routers, OSPF and DHCP"
        │
        ▼
  Your AI agent ──── Claude Code, OpenCode, Codex, Cursor… (any MCP client)
        │  calls pt_* tools
        ▼
  Packet Tracer MCP ─ plans → validates → auto-fixes → generates JS + IOS config
        │  authenticated HTTP bridge, 127.0.0.1:54321
        ▼
  MCP Control Center ─ this project's PT extension, polls the bridge every 500 ms
        │  runs the JavaScript in PT's Script Engine
        ▼
  Cisco Packet Tracer ─ devices, cables and configs appear on the canvas
With the extension window closed, a file mailbox takes over, so PT keeps executing. Everything stays on your machine: the bridge only listens on loopback and every call carries a per-machine token (see Security).
What it can do
| What | Tools | |
|---|---|---|
| Build | One prompt → plan → validation → auto-fix → live deploy, with read-back of every device and link | pt_full_build, pt_plan_topology, pt_validate_plan, pt_fix_plan, pt_live_deploy |
| Addressing | /24 LANs, /30 point-to-point links, DHCP pools on routers or on a dedicated Server-PT, IPv6 dual stack | pt_configure_dhcp_server, dual_stack=True |
| Routing | Static (with floating backups), OSPF, EIGRP, RIP; HSRP, BGP and QoS on a live router | generated IOS, applied live; pt_apply_hsrp, pt_apply_bgp, pt_apply_qos |
| Switching | VLANs, trunks, router-on-a-stick, STP, port security, EtherChannel, AP SSID and MAC filter | pt_apply_vlan, pt_apply_stp, pt_apply_port_security, pt_apply_etherchannel, pt_wireless_ap |
| Voice | Cisco CME on a 2811 with IP phones that register (measured with a PoE 3560 and two 7960) | pt_apply_voice |
| Security | ACLs, NAT, device hardening (SSH, local users, enable secret, banner) and an audit of the live config | pt_apply_acl, pt_apply_nat, pt_apply_hardening, pt_audit_security |
| Inside each device | Type in a router's CLI tab, run ping/ipconfig on a PC, configure Server-PT DHCP/DNS/HTTP/FTP/EMAIL, use the Web Browser and Email apps | pt_cli, pt_host_command, pt_server_*, pt_web_browser |
| Verify | Real ping with parsed results, health check, plan-vs-live diff, per-port inspection; every CLI change reports which IOS lines were rejected; structured reads of routes, OSPF, ARP, CDP, STP, ACL, NAT, MAC tables and DHCP leases | pt_verify_connectivity, pt_health_check, pt_diff, pt_inspect_ports, pt_read_routes, pt_read_ospf, … |
| Explain | Send a simple PDU, step the simulation and read PT's own per-layer decision log for each packet | pt_send_pdu, pt_simulation_mode, pt_simulation_step, pt_read_packet_trace |
| PKA Builder | Open and grade .pka activities item by item, or build a whole exam from one spec: answer network, instructions, graded items, initial network | pt_activity_create_exam, pt_activity_check, pt_activity_* |
| Document | Canvas screenshots, notes and drawings on the canvas, .pkt save/open, config backup, exported plans and configs | pt_screenshot, pt_add_note, pt_save_project, pt_backup_config, pt_export |
All 111 tools are listed in the tool reference.
Installation
Needs Cisco Packet Tracer 8.2+ (tested on 9.0 and 9.0.1) on Windows or macOS — see Platforms.
The easy way: ask your AI agent
Open Claude Code, OpenCode, Codex or any coding agent and say:
Install the Packet Tracer MCP from https://github.com/Mats2208/MCP-Packet-Tracer and set everything up for me.That's it. The agent finds its instructions here, checks your OS and agent, installs the server and the skill, and puts the extension where Packet Tracer finds it. The next time you open Packet Tracer it asks "detected a new script module… enable?" — click Yes. That click is the only thing you do by hand.
[!NOTE] AI agent reading this? Don't follow the manual steps below. Follow
llms-install.md— it is written for you: OS detection, every client's registration command, the skill, the extension, and how to verify with the user.
Manual install
1. Install uv — it brings its own Python, so
you don't need to install Python or touch PATH.
macOS · Linux: curl -LsSf https://astral.sh/uv/install.sh | sh
Windows (PowerShell): powershell -ExecutionPolicy ByPass -c "irm https://astral.sh/uv/install.ps1 | iex"
2. Connect your MCP client (Claude Code shown; other clients in the Installation docs)
claude mcp add --scope user --transport stdio packet-tracer -- uvx packet-tracer-mcp --stdioWindows PowerShell — quote the -- separator, or PowerShell swallows it and Claude aborts with error: unknown option '-m':
claude mcp add --scope user --transport stdio packet-tracer "--" uvx packet-tracer-mcp --stdioVerify with claude mcp list (look for packet-tracer … ✓ Connected).
3. Install the Agent Skill — required in practice: without it the AI guesses model, port and API names instead of discovering them
uvx packet-tracer-mcp install-skill                         # Claude Code, OpenCode → ~/.claude/skills
uvx packet-tracer-mcp install-skill --dest ~/.agents/skills # Codex
Then restart your agent (or run /reload-skills in Claude Code). Details →
Skill docs.
4. Install the live-deploy extension — Download MCP-Control-Center.pts from
Releases and drop it in Packet
Tracer's own extensions folder, in a subfolder (…/extensions/MCPControlCenter/). On macOS that is
Cisco Packet Tracer <version>.app/Contents/extensions/; on Windows
C:\Program Files\Cisco Packet Tracer <version>\extensions\ (needs admin). Next time PT starts it
asks "detected a new script module… enable?" — click Yes. Or add it by hand with
Extensions → Scripting → Configure PT Script Modules → Add…. Full walkthrough in Live deploy below.
v0.6.0+ requires extension V5 or newer (current: V6). The bridge authenticates with a per-machine token the extension reads automatically; builds before V5 can't authenticate.
Prefer pip?
pip install packet-tracer-mcp            # then use `python -m packet_tracer_mcp --stdio` as the command
pip install "packet-tracer-mcp[ui]"      # Windows: adds UI mode and the Activity Wizard
Requires Python 3.11+. On macOS (Homebrew) and recent Linux distros a plain pip install is refused
(externally-managed-environment, PEP 668): use uv as above, or a virtualenv. With uv, UI mode is
uvx --from "packet-tracer-mcp[ui]" packet-tracer-mcp --stdio.
From source, to modify it: git clone https://github.com/Mats2208/MCP-Packet-Tracer && cd MCP-Packet-Tracer && pip install -e .
Quick start
Restart your agent after installing, open Extensions → MCP BUILDER in Packet Tracer, and ask:
"Create a network with 1 switch and 2 PCs, deploy it to Packet Tracer and ping between the PCs."
"Build 3 routers in a triangle with OSPF, a LAN with 2 PCs behind each one, and DHCP."
"Check the network: show me R1's routing table and audit the security of every router."
The agent calls pt_full_build (plan → validate → generate → deploy), then verifies with a real
ping. More in the Quick Start guide.
Platforms
| Windows | macOS | Linux | |
|---|---|---|---|
Install by agent (llms-install.md, PT detects the extension) | ✅ | ✅ | ⚠️ server + skill yes; extension added by hand |
Server (uvx packet-tracer-mcp) | ✅ | ✅ | ✅ |
| Live deploy (HTTP bridge) | ✅ | ✅ | ✅ |
| File-bridge (extension window closed) | ✅ | ✅ | ✅ |
Device panel (pt_cli, pt_host_command, services…) | ✅ | ✅ | ✅ |
| UI mode (open/capture device windows) | ✅ | — | — |
| Activities: open, grade, mark, save | ✅ | ✅ | not tested yet |
| Activities: create and exam (Wizard) | ✅ | ✅ HTML instructions need PT_UI_ALLOW_FOREGROUND=1; no points or connectivity tests | — |
Activities: grade a password-protected .pka | not measured | ❌ the API rejects the right password | — |
Activities, status and limits: see PkaIndex.
macOS and Windows 11 were verified on Packet Tracer 9.0.1: every tool of that release ran against a live canvas on macOS, and on Windows the agent install, both bridge channels, OSPF + DHCP builds checked with real pings, and UI mode. The activity tools were measured on both; on macOS a whole exam was built through the MCP, reopened and graded 0 % → 100 %. The Wizard driver is shared and changed after the Windows run, so that run is pending. On Linux the core tools were verified live (below); the activity tools have only run offline there.
Linux was verified on 2026-11-03 with Ubuntu 26.04.1 LTS (kernel 7.0, GNOME 50 on Wayland),
Packet Tracer 9.0.1 from Cisco's .deb, packet-tracer-mcp 0.11.0 through uvx (uv 0.13.3)
and Claude Code 2.1.317 as the client. Both bridge channels connected (PT's webview is
QtWebEngine 6.8.7). Checked live: pt_full_build single LAN (4/4 devices, 3/3 links, DHCP lease)
and 3 routers with OSPF + DHCP (12/12, 12/12, 6 neighbours FULL, no convergence gaps), real pings
across LANs, pt_cli, pt_host_command, pt_host_ip_config, Server-PT HTTP / DNS / EMAIL,
pt_web_browser, pt_health_check, pt_screenshot, pt_save_project, and with the extension
window closed the file-bridge alone ran pings, CLI, add device + link and a DHCP lease.
Linux specifics:
- PT ships as an AppImage in
/opt/pt, so there is noextensionsfolder to drop the module into: addMCP-Control-Center.ptswith Extensions → Scripting → Configure PT Script Modules → Add…. - Before the first start, accept the EULA by running
packettracerin a terminal (launched from the menu it waits for an answer it never gets and no window appears). On Ubuntu 26.04 PT also needssudo apt install libopengl0 libts0t64. - PT reports
~/Cisco Packet Tracer 9.0.1/savesas its save folder, which does not exist on Linux (its real user folder is~/pt).pt_save_projectwithoutdirectorynow falls back to~/pt/savesinstead of hitting PT's "No Write Permission" dialog.
Live deploy
Live deploy runs through this project's own Packet Tracer extension, the MCP Control Center
(MCP-Control-Center.pts in Releases). Add it
once via Extensions → Scripting → Configure PT Script Modules → Add…, then open
Extensions → MCP BUILDER in each session. It connects to the bridge by itself and reads the
token from disk — there is nothing to paste or configure.
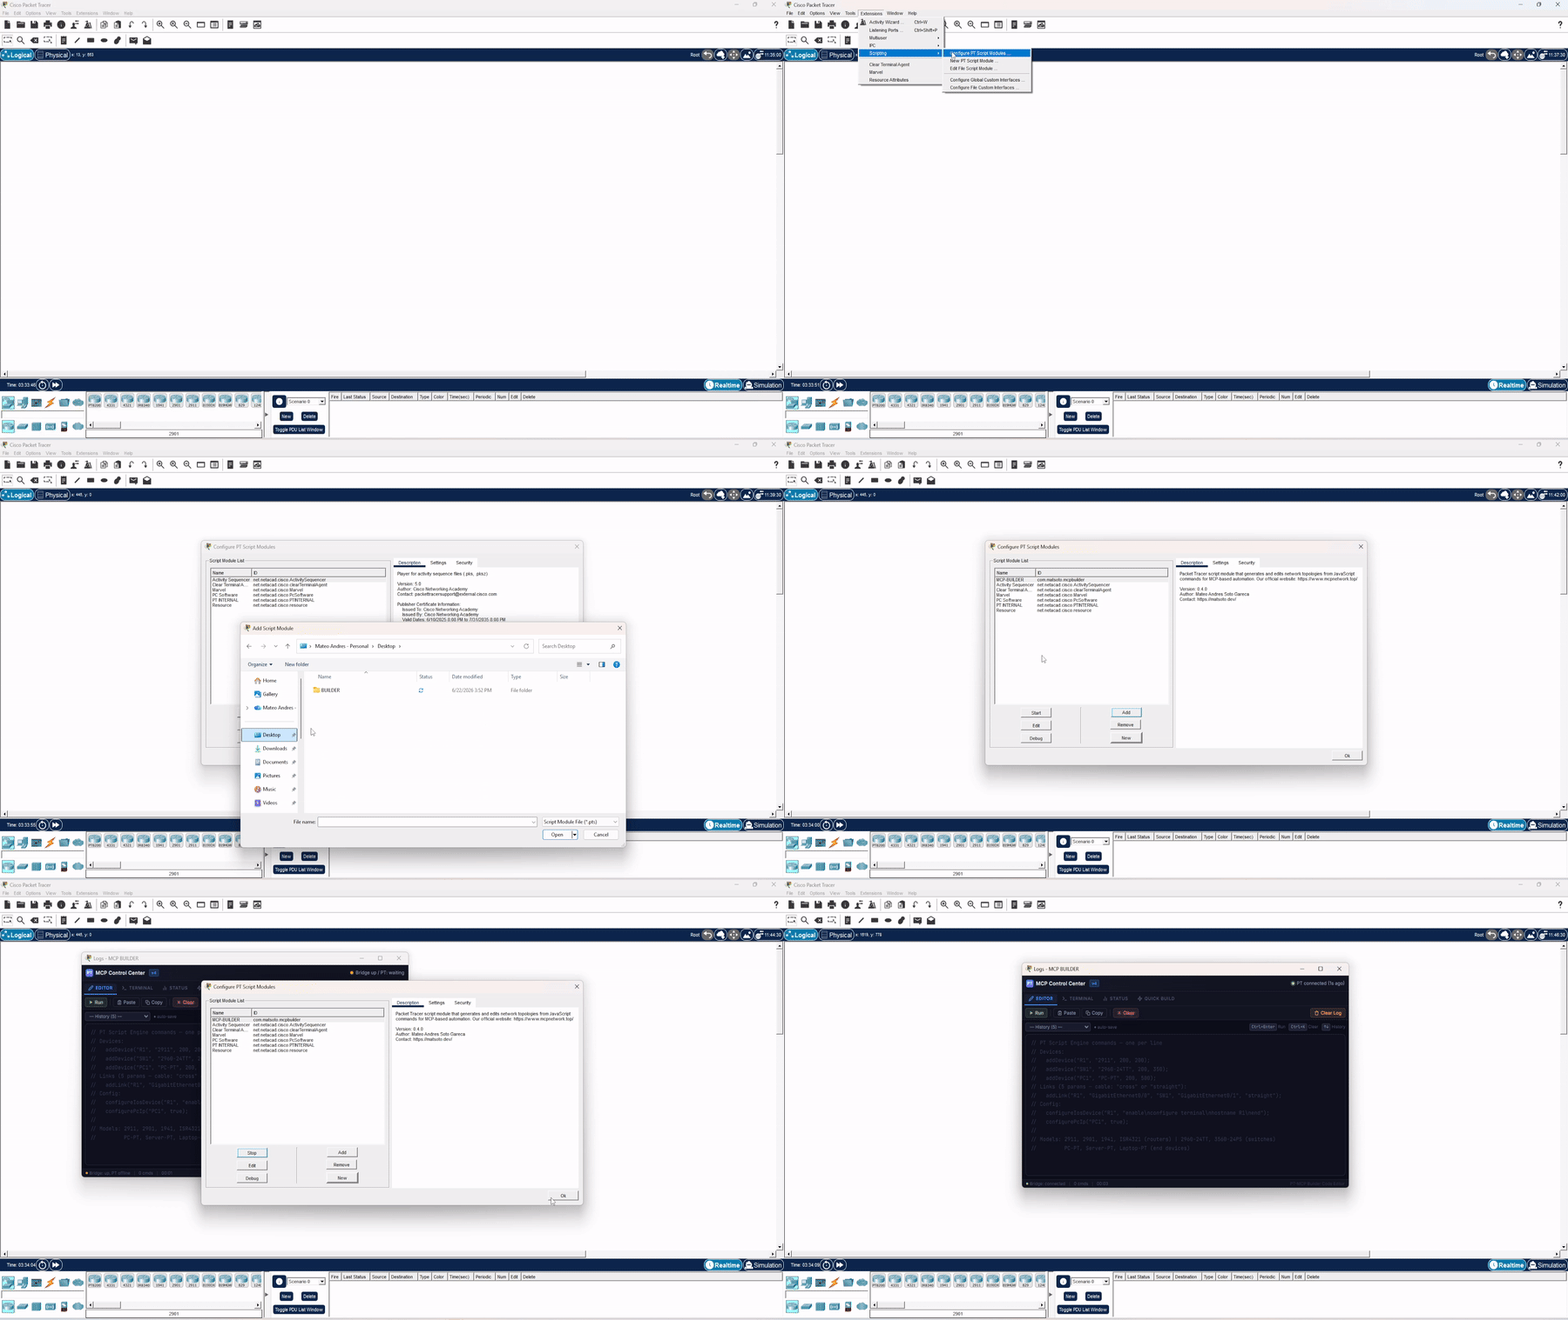
Adding the MCP Control Center extension to Packet Tracer
📖 Full steps → Live Deploy Setup.
Device panel and UI mode
Once a topology is live, the agent works inside each device the way a student would: it types in a router's CLI tab, runs commands in a PC's Command Prompt, sets IP Configuration, browses with the Web Browser and configures a server's Services — all through Packet Tracer's own API, so what it types shows up in the real CLI tab and you can take over at any time.
It is headless by default. On Windows, say "show it in Packet Tracer" (or call
pt_ui_mode("ui")) and every panel tool also opens the device's window on the matching tab;
capture=True saves a PNG. Windows are driven with UI Automation and a click posted to the
canvas — your real mouse and keyboard are never used.
Clients
Any MCP client drives this server — Claude Code, Cursor, Claude Desktop, VS Code with Copilot, Codex. Nothing in it is client-specific.
There is also one built on it: PacketSmith,
a terminal app that runs these tools with the network drawn beside the conversation — a
fabric tree and a canvas plan derived from the pt_* results themselves, so a device the
model says it created but did not never shows up.
| This server alone | This server + PacketSmith | |
|---|---|---|
| Where you talk | the MCP client you already use | a terminal app built for this one job |
| What you see | a chat log, plus PT in another window | split screen: reply left, live topology right |
| Topology | read out of the tool output | fabric tree and canvas plan, drawn for you |
| Tools loaded | every MCP server you have configured | this one only — measurably faster to start |
| Engine | whatever your client speaks | Claude, or ~150 providers |
You need this server either way — PacketSmith runs it underneath, and its setup installs it for you. If you already live in Claude Code, you are done here; the client is for when you want the topology in front of you instead of buried in a scrollback.
npm i -g packetsmith # beta · MITCredits & Acknowledgements
Live deploy runs through our own Packet Tracer extension — the MCP Control
Center (the .pts in Releases).
Its Script-Engine helper layer was inspired by
PTBuilder by
Kim Knight (@kimmknight), who pioneered driving
Packet Tracer's Script Engine from JavaScript — thanks for the groundwork. 🙏
PTBuilder and Packet Tracer MCP are separate, independent projects. You install our extension, not PTBuilder. Full Credits & Attribution.
Security
Driving Packet Tracer from outside means running a local HTTP bridge whose whole job is to hand JavaScript to PT's Script Engine — code that executes with PT's own privileges, including disk access. That makes the bridge a genuine attack surface, not an implementation detail, and it is hardened accordingly.
The attack this design exists to stop. Binding to 127.0.0.1 is not a
security control. A POST with Content-Type: text/plain is a CORS simple
request: any web page open in your browser can send it to a loopback port
without a preflight and without needing to read the response. An unauthenticated
bridge therefore lets any website you visit — while Packet Tracer happens to be
open — queue arbitrary code inside it. Injection never needed to read anything
back, so same-origin policy alone never closed this.
What actually closes it is a secret the attacking page cannot guess:
| Control | Implementation |
|---|---|
| Token on every endpoint | Every route except /ping requires a shared token (?t= or X-PT-Token). Compared with hmac.compare_digest — constant time, no early-exit oracle. |
/ping leaks nothing | Deliberately unauthenticated so the server can tell who owns the port before trusting it — but it returns only a SHA-256 fingerprint of the token, never the token. |
| Foreign-bridge detection | Before sending any payload, the server checks that /ping identity matches its own token fingerprint. If a stranger holds the port, it refuses to hand code to it instead of blindly trusting a 200. |
| DNS-rebinding defense | The Host header is validated against 127.0.0.1 / localhost / [::1] + the real port. A rebound request arrives as Host: evil.com:<port> and is rejected. |
| Loopback bind | ThreadingHTTPServer(("127.0.0.1", port)) — never 0.0.0.0, so the bridge is not reachable from the LAN. |
| Token at rest | secrets.token_urlsafe(32), created with O_EXCL (race-safe when two servers start at once) at mode 0o600, under %LOCALAPPDATA% on Windows — deliberately not roaming %APPDATA%, so a loopback secret never syncs to a file server. |
| Body size cap | Oversized bodies are rejected with 413 and are not read into memory. |
| Silent failures | Error responses carry no CORS headers, so a hostile page cannot even distinguish why it failed. |
| Tamper visibility | Unauthorized attempts are counted and surfaced by pt_bridge_status, so a stale or rogue client is diagnosable instead of silent. |
Regression coverage lives in tests/test_bridge_security.py
and tests/test_injection_regressions.py;
the full suite runs offline with python -m pytest — no Packet Tracer required.
v0.6.0+ requires extension V5 or newer. Versions before v0.6.0 shipped an unauthenticated bridge and are vulnerable to exactly the attack above. Upgrade — there is no safe configuration of the old bridge.
Deliberate, documented behaviour: pt_send_raw executes arbitrary JavaScript
inside Packet Tracer by design — it is the escape hatch for exploring the IPC
API. It is reachable only by an MCP client you have already authorised, over the
authenticated bridge. That is a capability, not a vulnerability.
Found a vulnerability? Report it privately via GitHub Security Advisories, not a public issue. SECURITY.md documents the full threat model.
What's new
v0.12.0 — PKA Builder for CCNA classes: 13 pt_activity_* tools open, grade and build .pka
activities, and pt_activity_create_exam builds a whole exam from one spec. The Activity Wizard runs on Windows
and macOS. Also: plans laid out by topology and fitted to your canvas (pt_canvas_info, pt_auto_layout), and
Linux verified live on Ubuntu 26.04.
v0.11.0 — live reads that flag what has not converged (routes, OSPF, ARP, CDP, STP, ACL, NAT, MAC tables, DHCP leases), real PDUs with PT's own per-layer reason, Fast Forward Time, CME voice measured end to end, HSRP, BGP, QoS, EtherChannel, Wi-Fi AP settings, and static IPv6 on hosts.
v0.10.0 — install by asking your agent (llms-install.md),
the skill inside the package, and 17 device-panel tools that work inside each device. Older releases in the
Changelog.
Contributing
See CONTRIBUTING.md. The
test suite (1,697 tests) runs offline with uv run --extra test python -m pytest — no Packet Tracer needed.
License
Released under the MIT License — © 2026 Mateo (@Mats2208).
Built with MCP · Deploys to Cisco Packet Tracer · Script-engine logic inspired by PTBuilder
If this project is useful to you, star it ⭐ and share it with the community.