MikroDash
The Ultimate MikroTik RouterOS Dashboard.
Real-time MikroTik RouterOS v7 dashboard — streaming binary API, Socket.IO, Docker-ready.
MikroDash connects directly to the RouterOS API over a persistent binary TCP connection, streaming live data to the browser via Socket.IO. No page refreshes. No agents. Just plug in your router credentials and go.
![]()
Screenshots
Dashboard
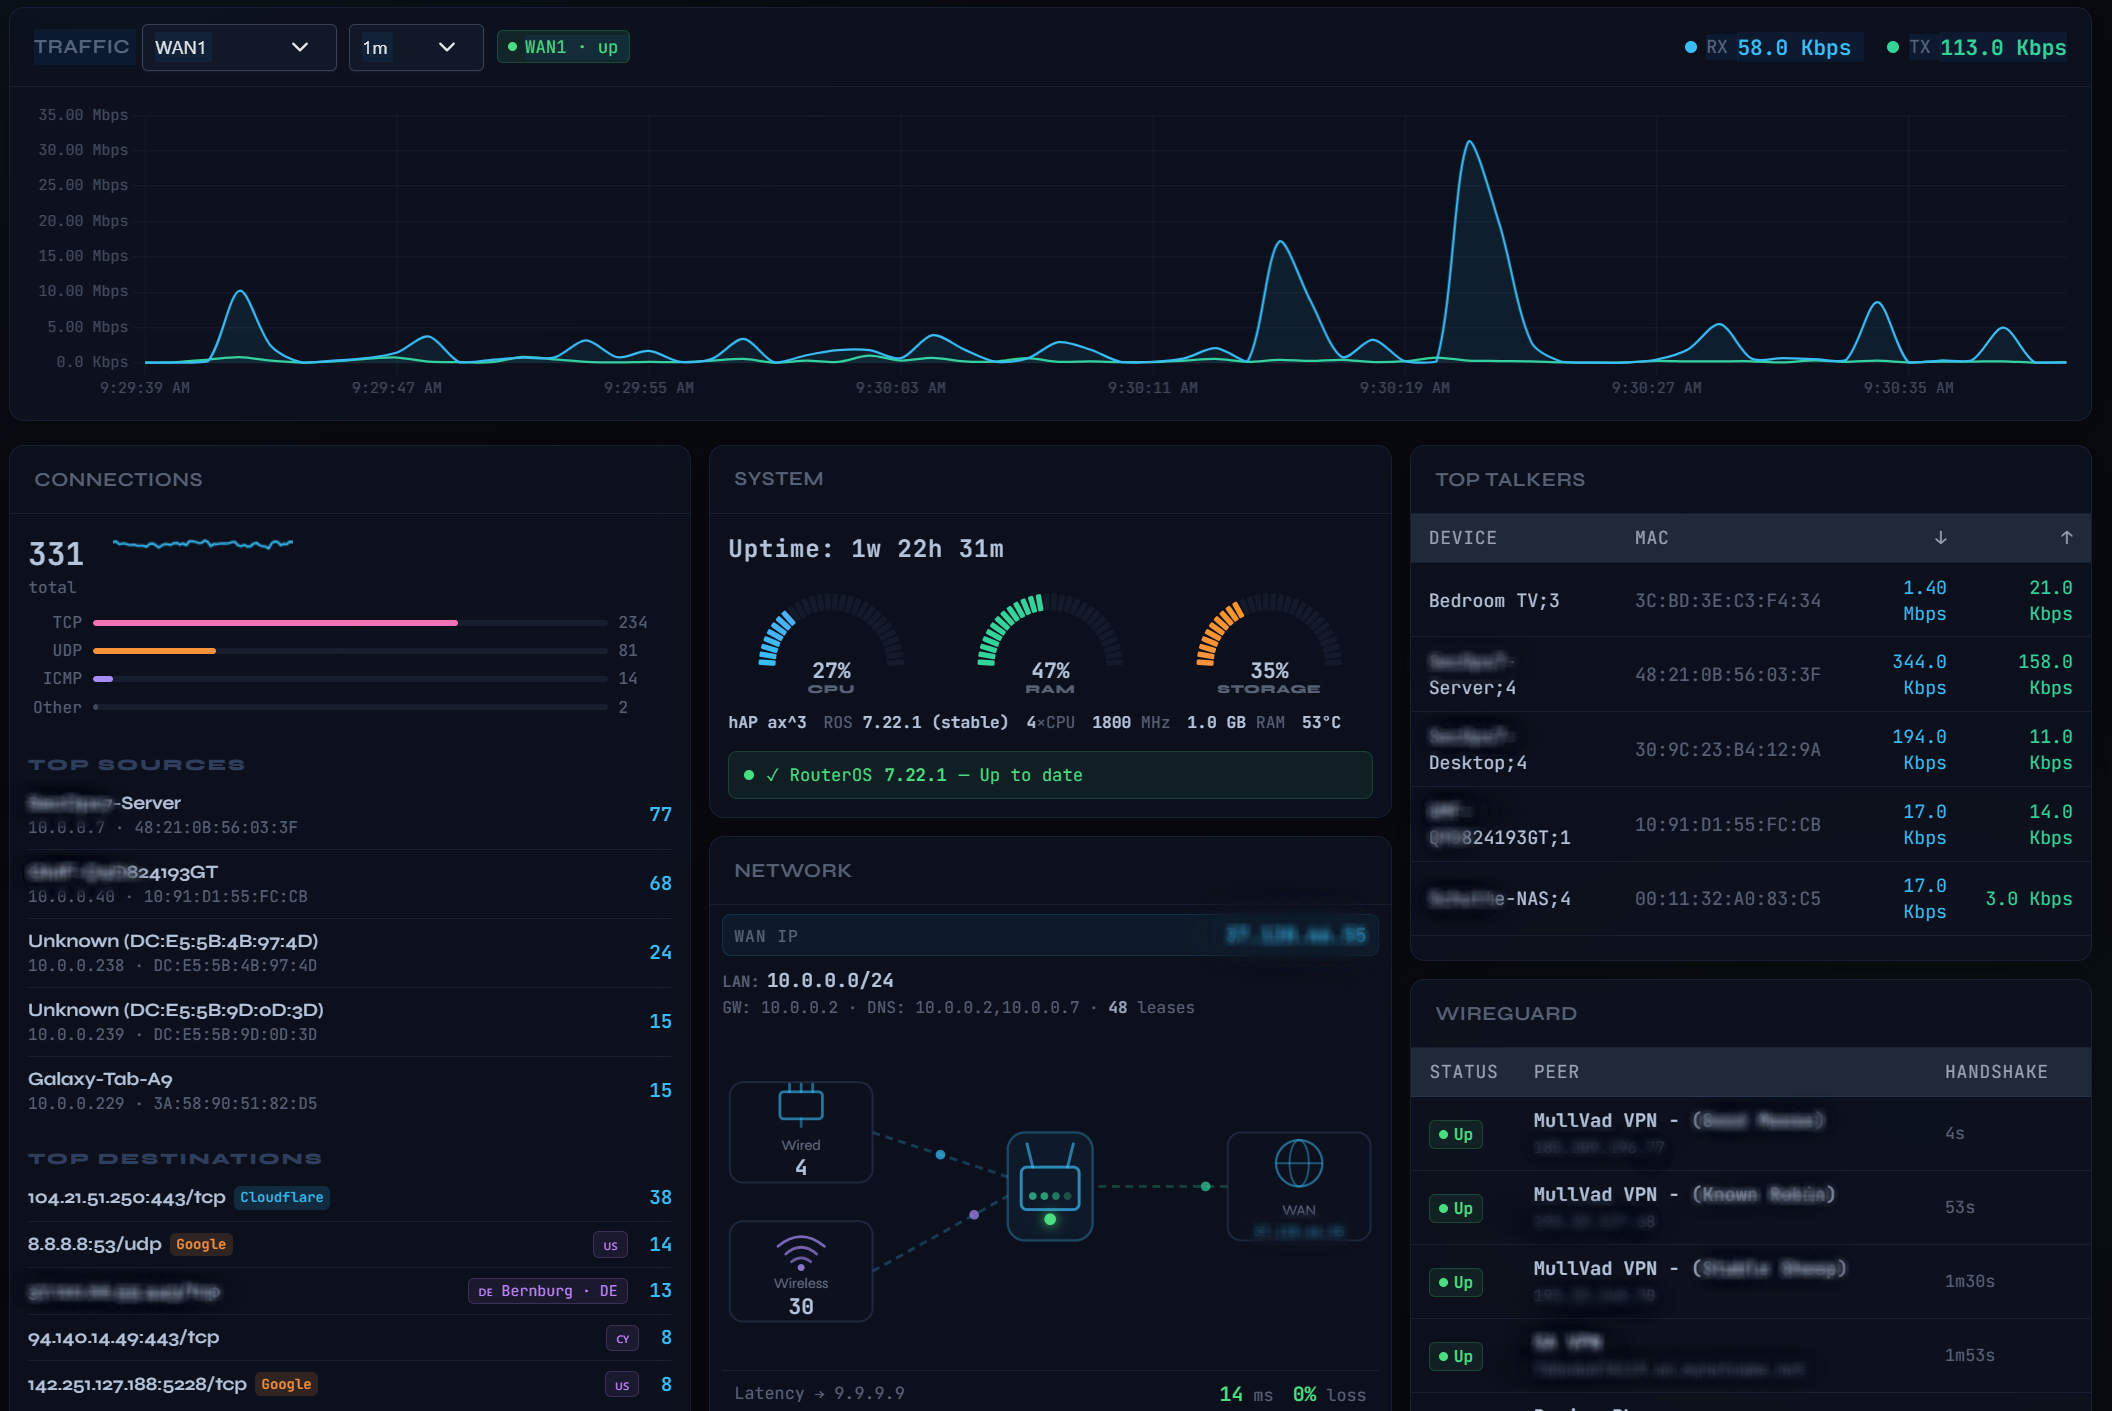
Connections
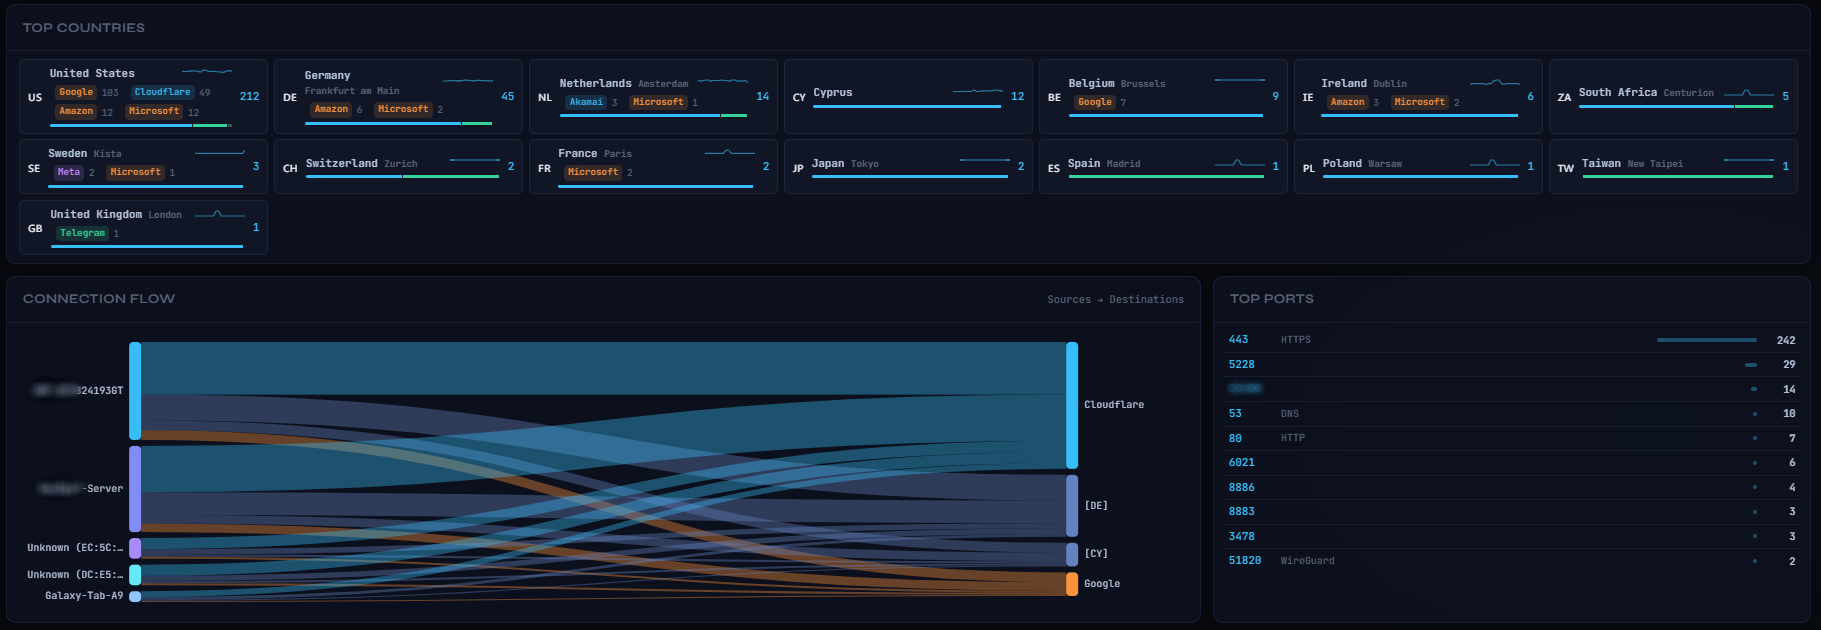
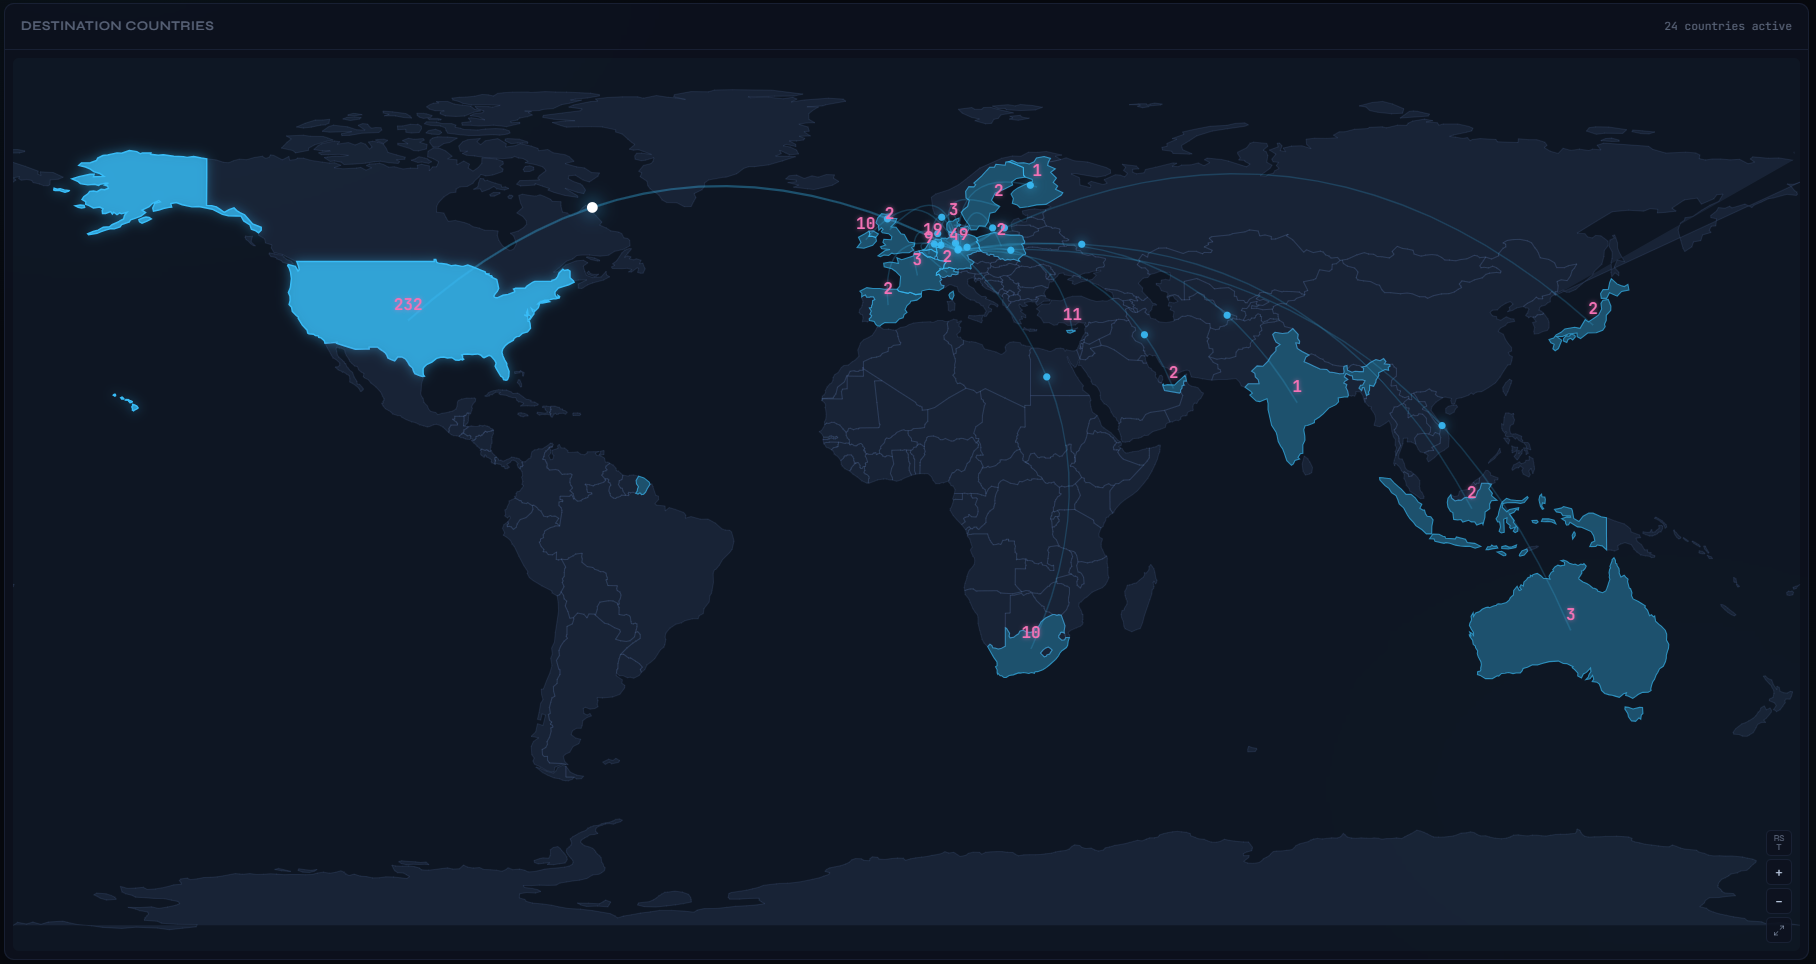
Connections Map
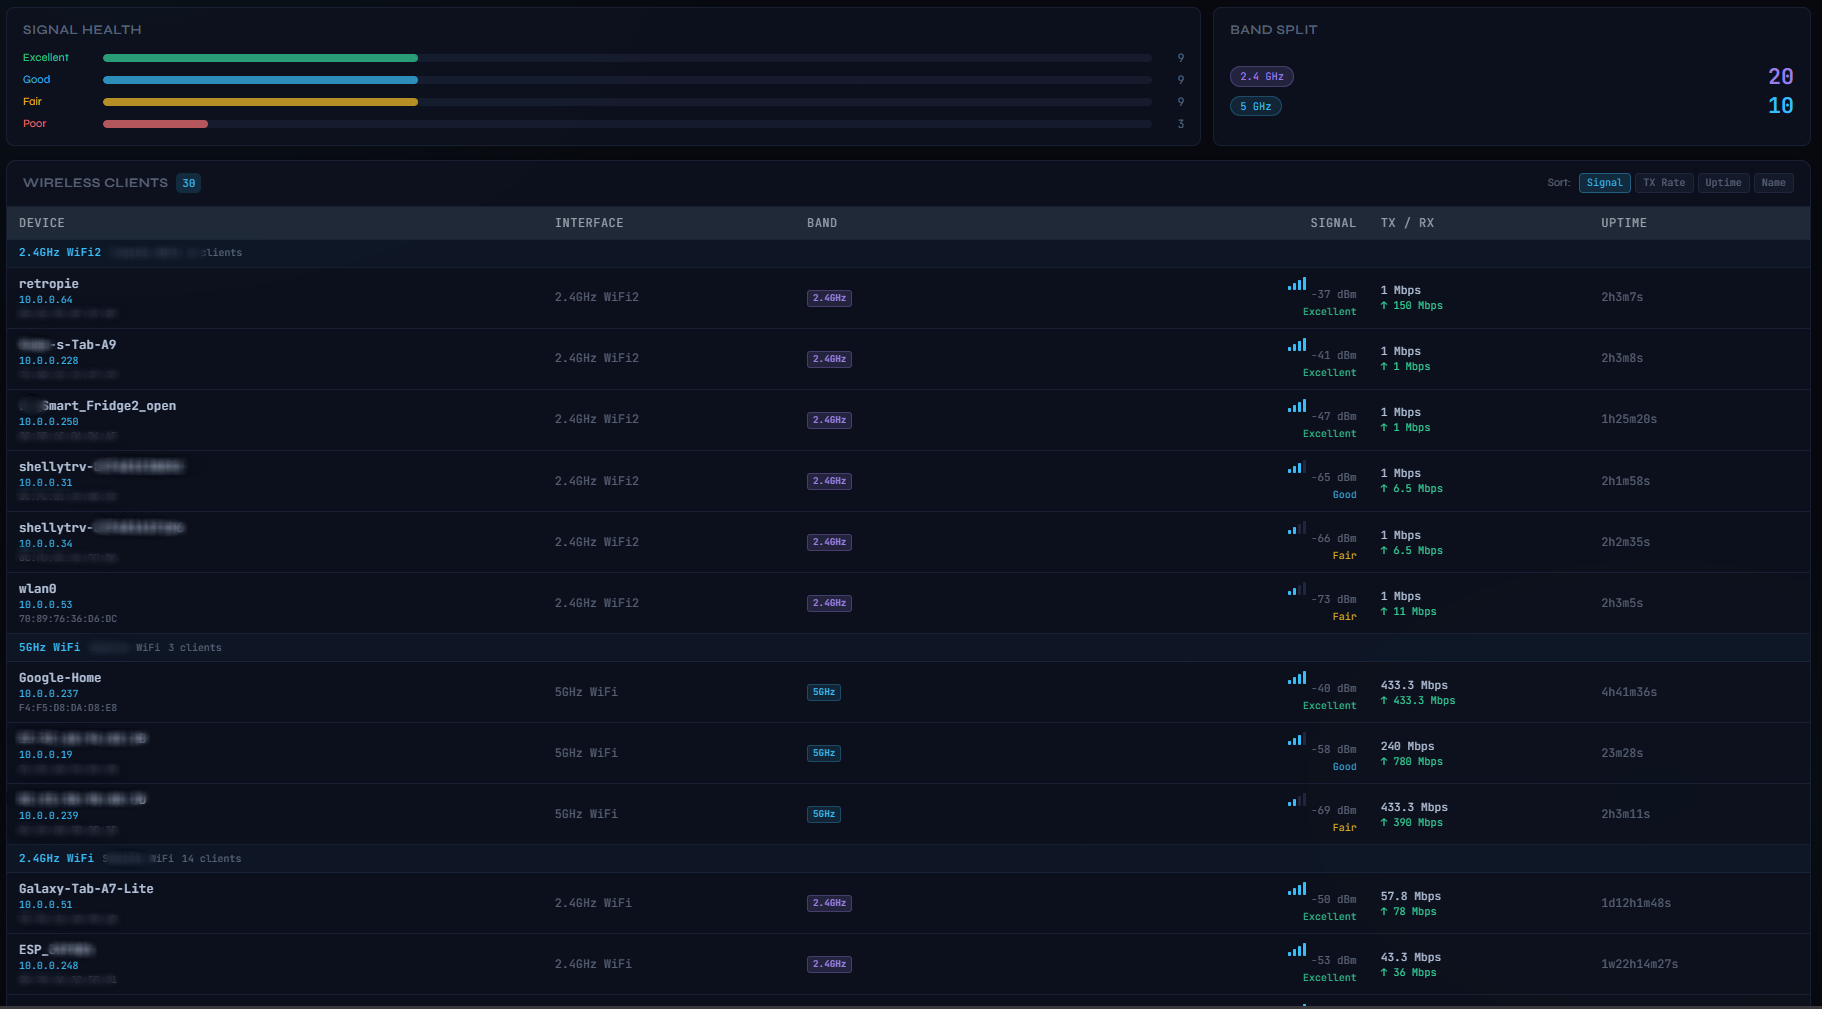
Wireless Clients
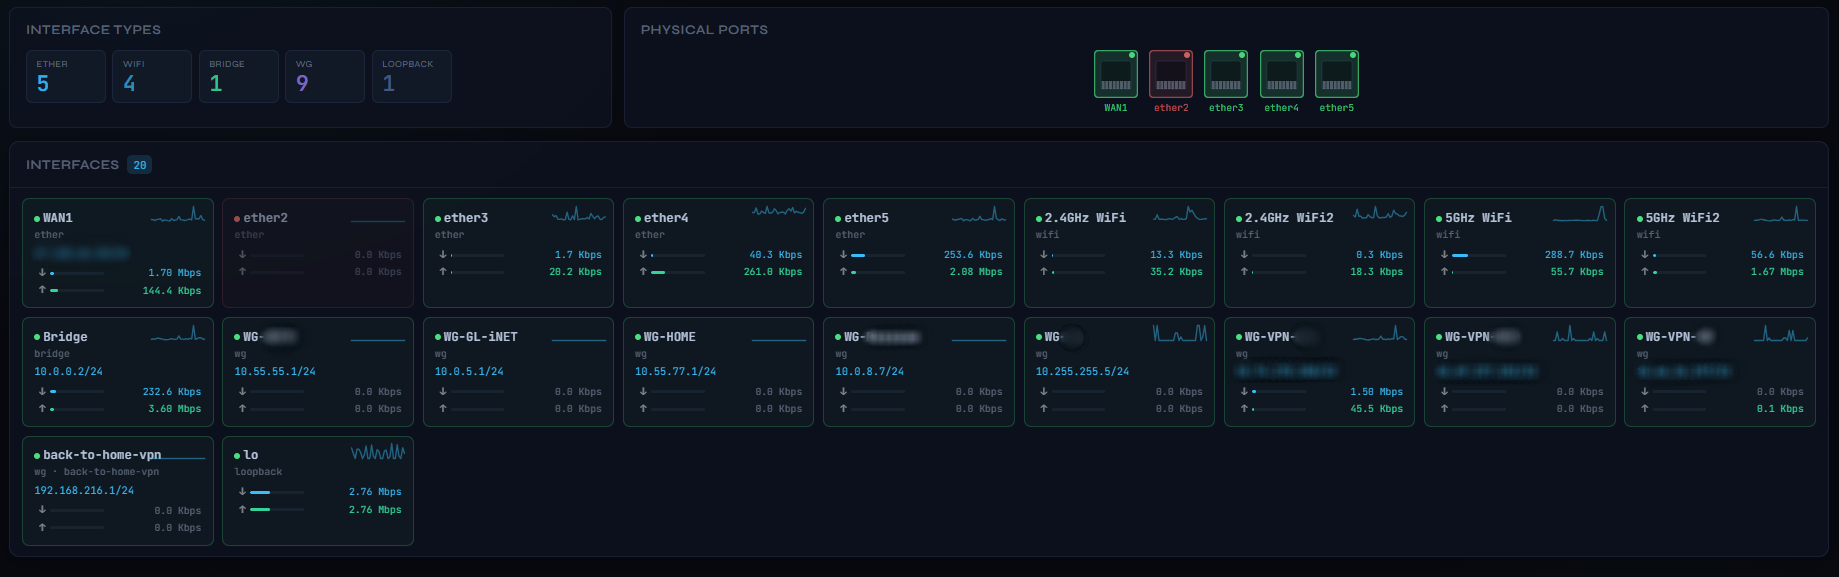
Router Interfaces
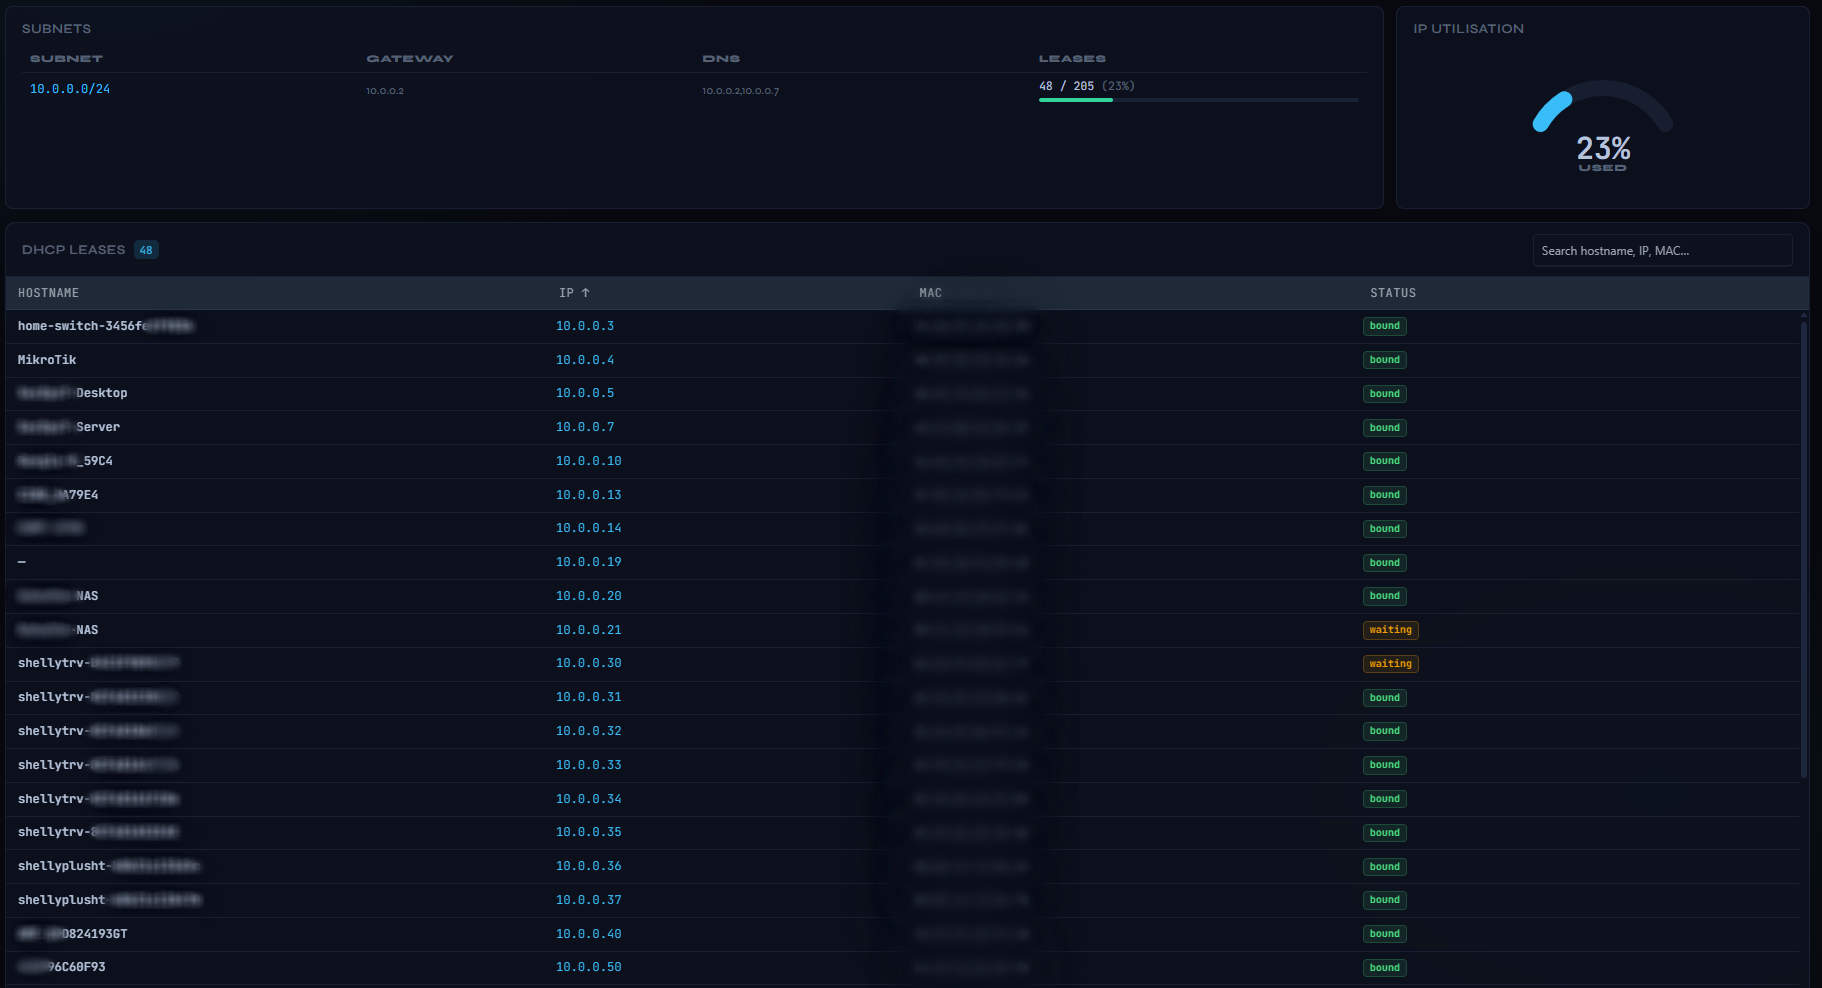
DHCP Leases
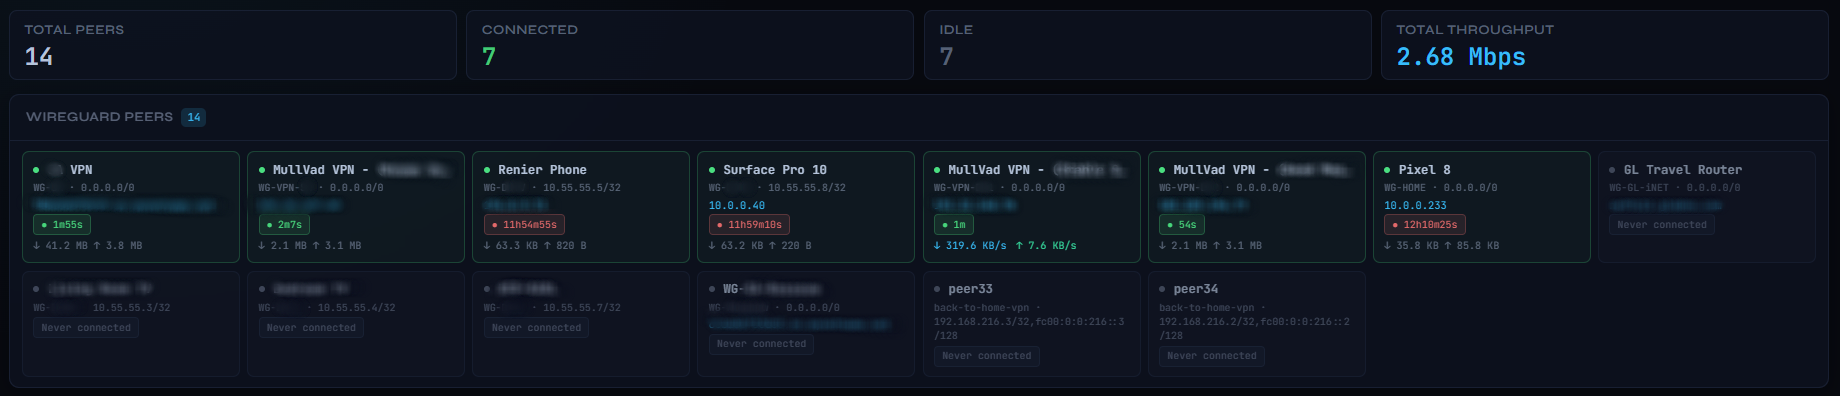
VPN / WireGuard
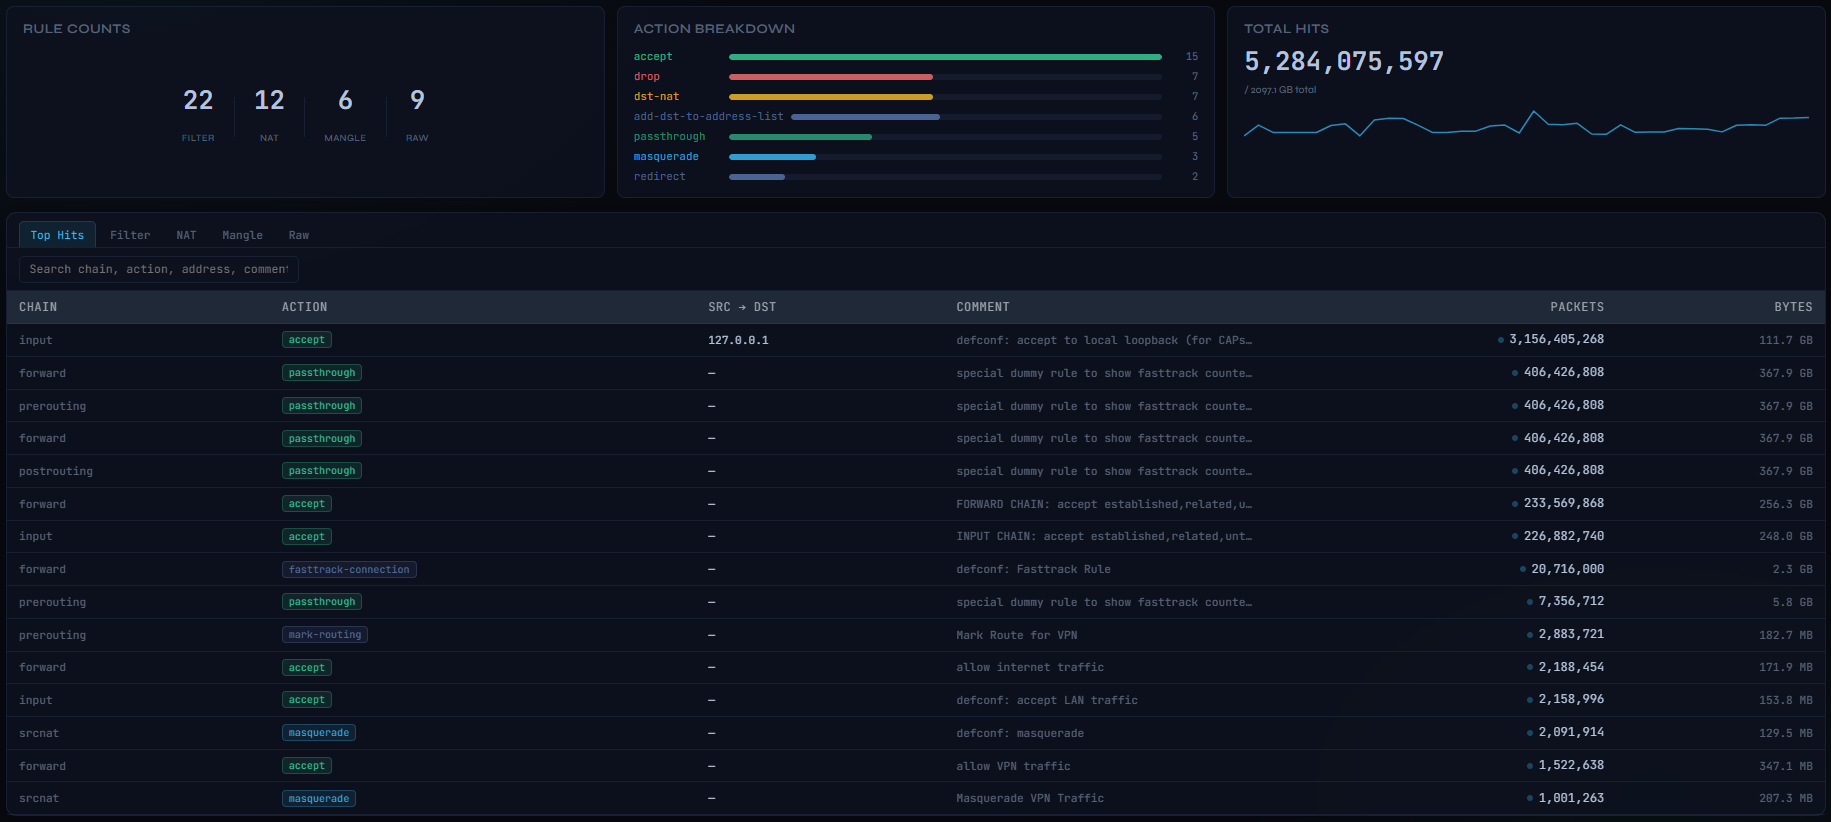
Firewall
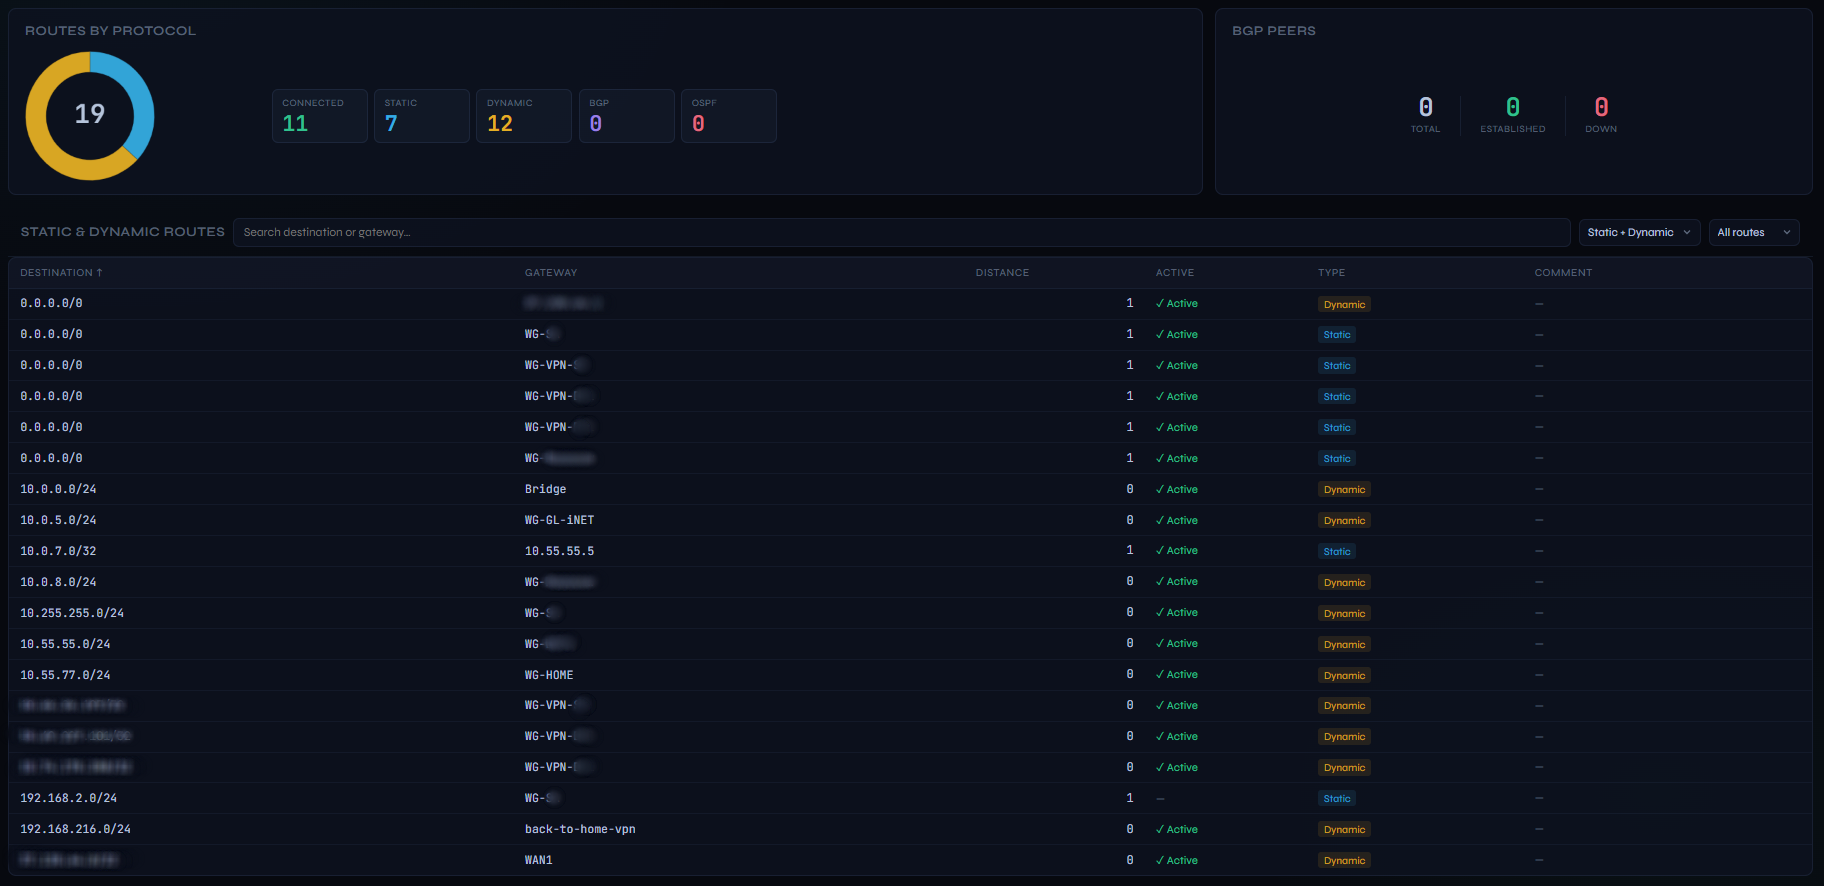
Routing
Bandwidth
Logs
Features
Dashboard
- Configurable drag-and-drop grid — 24×22 layout; drag cards to reposition, resize with 8 handles, or swap positions by hovering one card over another for 1.5 s; add/remove cards via the Add Card panel; layout synced server-side so all browsers and devices share the same arrangement
- Live traffic chart — per-interface RX/TX Mbps with configurable history window
- System card — CPU, RAM, Storage gauges with colour-coded thresholds (amber >75%, red >90%), board info, temperature, uptime chip
- RouterOS update indicator — shows installed vs available version side by side
- Network card — animated SVG topology diagram with live wired/wireless client counts, WAN IP, LAN subnets, and latency chart
- Connections card — total connection count sparkline, protocol breakdown bars (TCP/UDP/ICMP), top sources with hostname resolution, top destinations with geo-IP country flags and click-to-filter
- Top Talkers — top 5 devices by active traffic with RX/TX rates
- WireGuard card — active peers sorted by most recent handshake, limited to a configurable Top N (default 5)
- Multi-router switcher — monitor multiple MikroTik routers from one dashboard instance; switch between them via the dropdown in the page header with no restart or page refresh required
- First-run setup wizard — on a fresh install with no router configured, a guided setup overlay appears automatically; enter router details, test the connection, and connect — no
.envfile or container restart needed
Optional dashboard cards (15, hidden by default)
| Card | Description |
|---|---|
| Signal Health | Per-client RSSI bars for all wireless interfaces |
| Band Split | 2.4 / 5 / 6 GHz client count breakdown |
| Physical Ports | RJ-45 port visualiser colour-coded by link state |
| IP Utilisation | DHCP pool gauge with live lease percentage |
| Connections Map | World map with animated arcs — identical to the Connections page map |
| Top Countries | Country list with connection counts and protocol breakdown |
| Connection Flow | Source → destination Sankey diagram |
| Top Ports | Top 10 destination ports with connection counts |
| Routes | Routes-by-protocol doughnut with total in centre |
| BGP Peers | BGP session state and prefix counts |
| Bandwidth | Download / Upload utilisation bars (% of configured capacity, 30 s average) |
| Firewall Actions | Action breakdown bars (accept / drop / reject / other) |
| Chain Count | Rule count per chain type (forward / input / output / srcnat / dstnat / prerouting etc.) across all tables, shown as a colour-coded vertical bar chart |
| Logs | Live scrolling router log feed |
| NetWatch | Live status table for RouterOS NetWatch monitored hosts (up/down state, last change) |
Pages
| Page | Description |
|---|---|
| Wireless | Signal Health and Band Split summary cards; clients grouped by interface with signal quality, band pill (2.4 / 5 / 6 GHz), IP, TX/RX rates, and sortable columns |
| Interfaces | Physical Ports card (RJ-45 port visualiser, colour-coded by state) and Interface Types card (count by type); all interfaces as compact tiles with status, IP, live rates, cumulative RX/TX totals, and per-card traffic trend sparkline |
| DHCP | Subnet utilisation card with per-network lease counts, pool sizes, and colour-coded progress bars; IP Utilisation gauge driven live from the lease stream; active lease table with hostname, IP, MAC, and status; sortable columns |
| VPN | Summary stats bar (Total / Connected / Idle / Throughput); all WireGuard peers as tiles sorted active-first, with colour-coded handshake age badge, live RX/TX rates, allowed IPs, and endpoint |
| Connections | World map with animated arcs to destination countries; per-country protocol breakdown and org breakdown; sparklines; top ports panel; click-to-filter by country or by individual LAN client |
| Firewall | Rule Counts, Action Breakdown, and Chain Count summary cards; search bar; Filter, NAT, Mangle, and Raw rule tables (tab-gated — only the active tab streams); packet counts, byte totals, and live delta-pulse indicators |
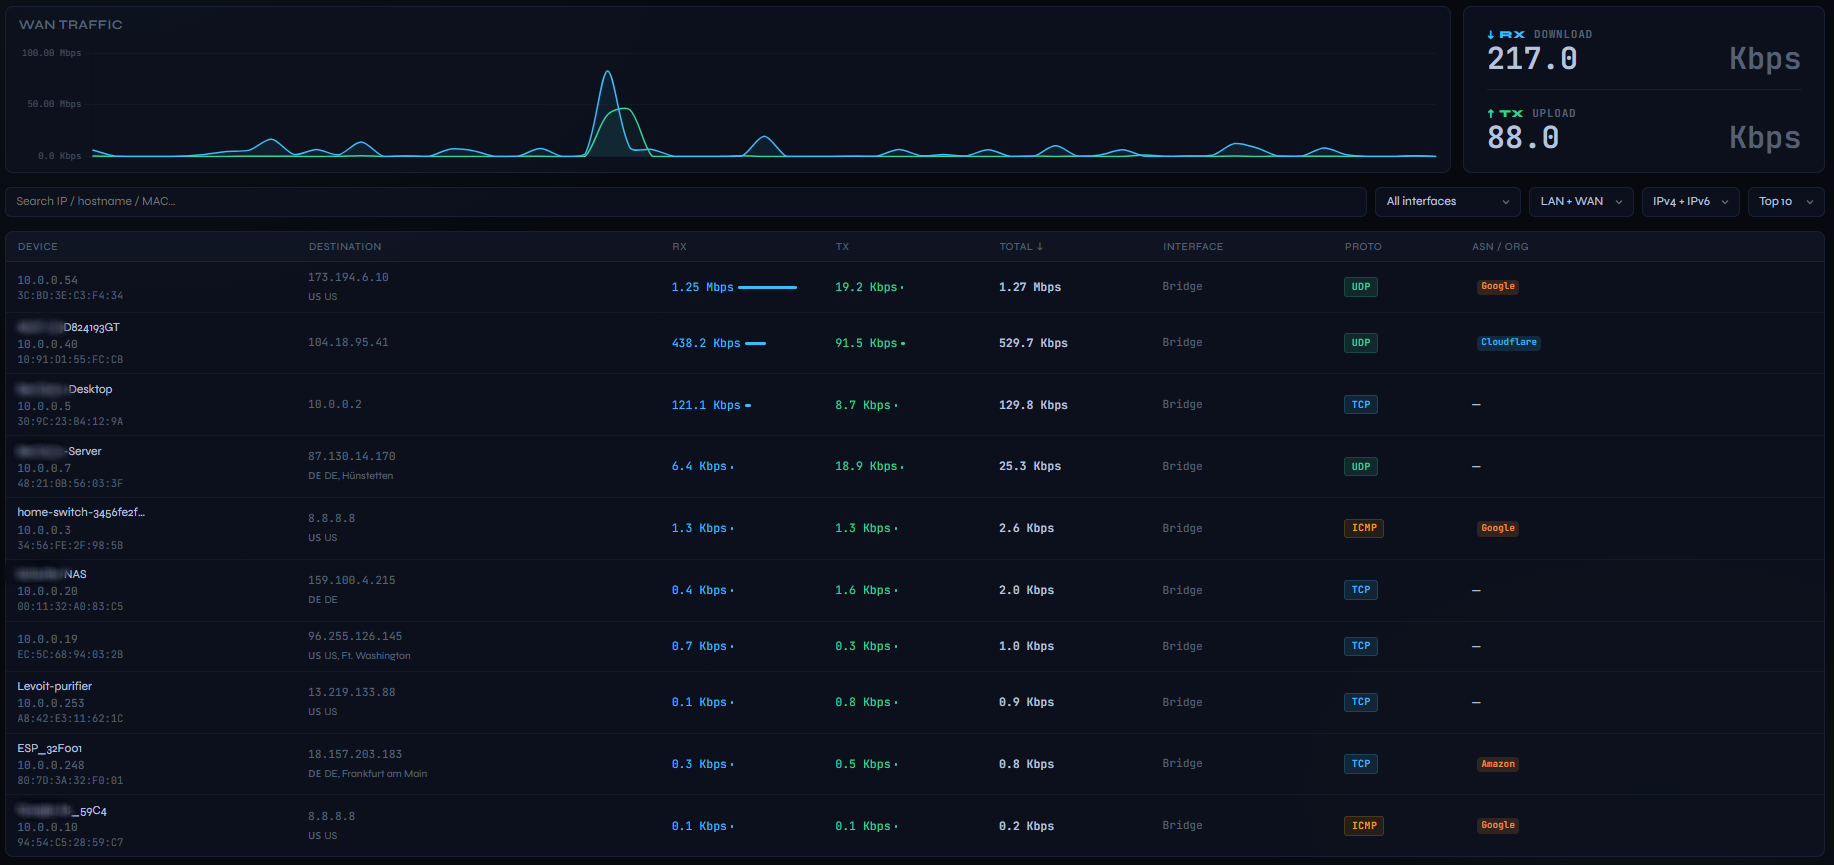
| Bandwidth | Live per-connection bandwidth table with RX, TX, and Total Mbps; sortable columns; WAN traffic chart; ASN/Org colour-coded badges; interface and protocol filters |
| Routing | Route count summary by protocol with doughnut chart (total displayed in chart centre); static and dynamic route table (event-driven via /ip/route/listen); BGP peer table with state badges, prefix trend sparklines, and session flap detection (event-driven via /routing/bgp/session/listen) |
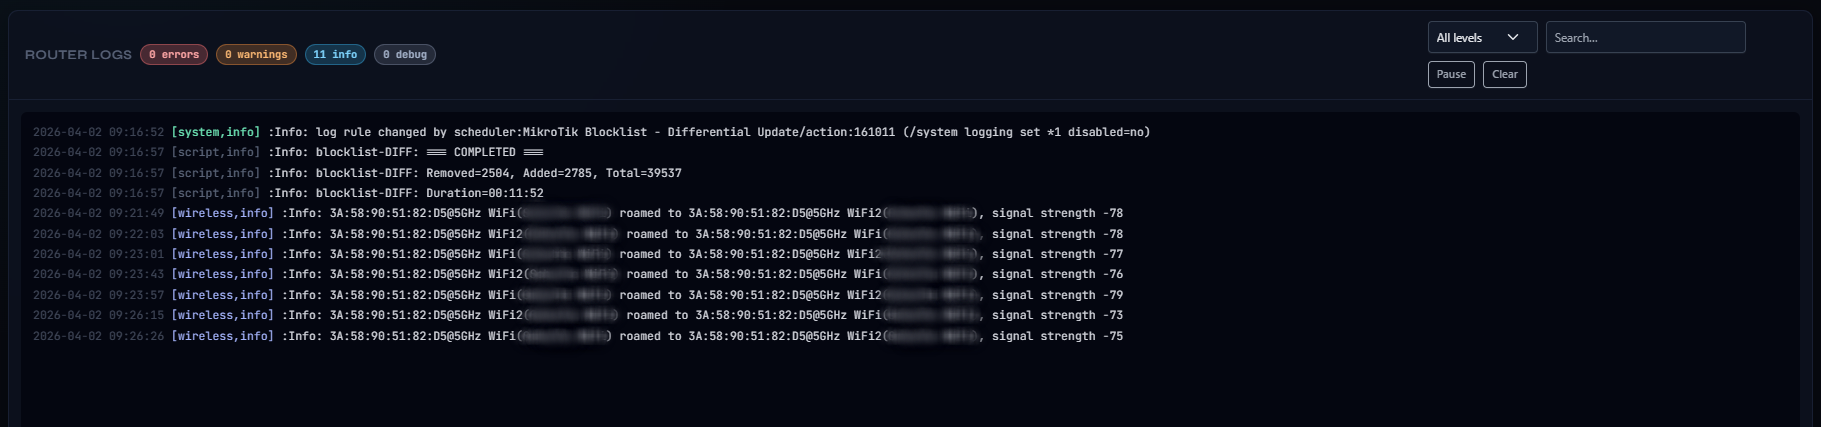
| Logs | Live router log stream with historical log import on connect, severity filter and text search |
| Reports | Historical data viewer with configurable date range and aggregation. Five tabs: Ping (RTT chart + sortable table), Traffic (per-interface RX/TX chart + table), Bandwidth (usage chart + table), Alerts (alert event history), Connectivity (router up/down event history). CSV and PDF export on every tab. Admin-only |
| Routers | Per-router overview cards showing connection status (WiFi icon), CPU / RAM / Disk usage bars, Uptime, DHCP client count, and live WAN RX/TX rates; board name, RouterOS version, architecture, serial number, and license level pills. Background sessions pre-load data at startup so cards are populated instantly on first visit. Hidden for single-router setups |
| Settings | Persistent UI configuration — see below |
Notifications
- Bell icon in topbar opens an alert history panel showing the last 50 alerts with timestamps
- Browser push notifications (when permitted) for interface, VPN, CPU, ping, and NetWatch events
- Push notification channels — Telegram Bot, Pushbullet, and SMTP email; all three can be active simultaneously; credentials stored AES-256-GCM encrypted
- Per-router alert monitoring — lightweight background connection to non-active routers so alerts fire for any configured router, not just the one currently displayed; opt-in per router
- Alert types — Interface up/down (per interface type: ether/wlan/bridge/vlan), WireGuard peer state, CPU ≥ threshold, ping loss ≥ threshold, NetWatch host reachability, router online/offline
- Independent Up/Down templates — separate
notifBody(⚠️ alert) andnotifBodyUp(✅ recovery) templates with{{alertType}},{{routerName}},{{detail}}, and more variables - Configurable cooldown (10 s – 60 min) prevents duplicate notifications per alert subject
⚠️ Security Notice
MikroDash is designed to run on your local network only. It has no built-in HTTPS (terminate TLS at a reverse proxy if you need it).
MikroDash supports two authentication modes (Settings → Authentication): none (open access) and modern (cookie sessions with per-user accounts, admin/viewer roles, and optional per-user router restrictions). none mode serves the dashboard with no authentication — the server logs a startup warning in that state.
Do not expose MikroDash directly to the internet. Doing so would allow anyone (in an unauthenticated mode) to:
- View live data from your router (traffic, clients, connections, firewall rules, logs)
- Read your WAN IP, LAN topology, and connected device information
- Monitor your network activity in real time
If you need remote access, enable modern auth and place MikroDash behind an authenticating reverse proxy (such as Nginx, Authelia, or Cloudflare Access) or access it exclusively over a VPN.
Recommended local hardening:
- Enable authentication: switch to
modernmode and create user accounts with appropriate roles in Settings → Authentication - Run on a non-default port and bind to your LAN interface only
- Use a dedicated read-only API user on the router (see RouterOS Setup below)
- User passwords are scrypt-hashed in
/data/users.json(mode 0600); the encryption key for stored router credentials is auto-generated and saved to/data/.secret(mode 0600) — keep your Docker volume secure
Quick Start
Option 1 — GHCR (recommended)
Pull and run the pre-built image directly — no need to clone the repo or create a .env file:
docker pull ghcr.io/secops-7/mikrodash:latestThe image is built automatically by GitHub Actions on every push to main and on version tags. It is published as a multi-arch manifest covering linux/amd64, linux/arm64, and linux/arm/v7. Docker will automatically pull the correct layer for your platform — this includes Raspberry Pi 4/5, MikroTik's own R5S/RB5009 companion boards, Apple M-series machines running Linux containers, and ARMv7 devices such as MikroTik routers running RouterOS containers.
To pin to a specific release:
docker pull ghcr.io/secops-7/mikrodash:0.5.43Run with Docker Compose — create a docker-compose.yml:
services:
  mikrodash:
    image: ghcr.io/secops-7/mikrodash:latest
    restart: unless-stopped
    ports:
      - "3081:3081"
    volumes:
      - mikrodash-data:/data

volumes:
  mikrodash-data:
docker compose up -dOpen http://localhost:3081 — the first-run setup wizard will guide you through adding your router. No .env file is required.
Option 2 — Build from source
git clone https://github.com/SecOps-7/MikroDash.git
cd MikroDash
docker compose up -d
To build a multi-arch image locally (requires Docker Buildx):
docker buildx build --platform linux/amd64,linux/arm64,linux/arm/v7 -t mikrodash:local --load .- Dashboard:
http://localhost:3081 - Health check:
http://localhost:3081/healthz(200only after startup completes and RouterOS is connected)
Source builds require the bundled node-routeros compatibility patch. If startup reports a missing patch marker, run node patch-routeros.js again before launching MikroDash.
For a production-style deployment on an external Docker host such as an R5S that connects to a MikroTik hEX S over the RouterOS API, see docs/deploy-r5s.md and the ready-to-copy files in deploy/r5s/.
Settings
Most configuration is managed through the Settings page in the UI (gear icon at the bottom of the sidebar). Settings are saved to /data/settings.json on the Docker volume and persist across container restarts.
| Section | What you can configure |
|---|---|
| Routers | Add, edit, and delete router connections. Each entry stores host, port, username, password (encrypted), TLS options, WAN interface, and ping target. Test Connection validates credentials before saving. The active router is selected from the dropdown in the page header |
| Authentication | Auth mode (none / modern cookie sessions). In modern mode: manage user accounts with admin/viewer roles, optional per-user router restrictions, and a configurable session timeout. Passwords are scrypt-hashed |
| Poll Intervals | Per-collector update intervals with Polling Profile preset buttons (Fast / Faster / Standard / Slow / Slower / Custom). Drag any slider to enter Custom mode; Save Custom Profile persists your values as a reusable template. Changes apply immediately without restart. Pure event-driven collectors (ARP, Routing, DHCP Leases, Firewall rule changes) show an Event-driven badge instead of a slider |
| Collection Method | Per-collector toggle between Stream (RouterOS pushes data continuously via =interval=N) and Poll (one-shot request every poll interval). Covers System/Gauges, Ping, Connections, Top Talkers, and Interface Rates. Switch individual collectors to Poll on CHR/VM routers with limited API handler threads (typically 2–4). Traffic is always streamed. Changes apply immediately |
| Limits | Top N values for connections, talkers, firewall rules, and VPN dashboard peers; max connection rows; traffic history window |
| Alert Thresholds | CPU alert threshold (%) and ping loss alert (%) for browser notifications |
| Notifications | Push notification channels — Telegram Bot, Pushbullet, and SMTP email (all three can be active simultaneously); per-type toggles (interface up/down, WireGuard, CPU, ping, NetWatch, router status); separate ⚠️ alert and ✅ recovery message templates with {{variable}} substitution; configurable cooldown (10 s – 60 min) per alert subject; test-send button per channel |
| Data Retention | Traffic/ping/bandwidth sample retention (1–3650 days, default 90) and alert/connectivity event retention (1–3650 days, default 365); pruning runs automatically |
| Diagnostics | Enable/disable verbose RouterOS API debug logging at runtime — no container restart required |
| Appearance | 26 named palette swatches (dark and light variants) — applies instantly and persists via localStorage. Contrast, Text Brightness, and Background Brightness sliders (15 steps each) for fine-grained adjustment independent of palette. Font Family picker with 24 self-hosted options (Inter, IBM Plex Sans, Source Sans 3, Geist, JetBrains Mono, and 19 more — all served as local WOFF2 files, no CDN). Font Size with six presets (Extra Small to Extra Large). Includes a Visible Pages subsection to toggle individual pages on/off |
Credential encryption
Router and dashboard passwords are encrypted at rest using AES-256-GCM. On first start, MikroDash automatically generates a random 64-character key and saves it to /data/.secret on the Docker volume (mode 0600). This key is tied to your volume — as long as you keep the volume, your encrypted credentials are safe.
If you need to move credentials across volumes or manage the key yourself, set DATA_SECRET in a .env file and mount it:
DATA_SECRET=your-long-random-secret-hereThe DATA_SECRET env var always takes priority over the auto-generated /data/.secret file when set.
RouterOS Setup
Create a read-only API user (recommended):
/ip service set api port=8728 disabled=no
/user group add name=mikrodash policy=read,api,test,!local,!telnet,!ssh,!ftp,!reboot,!write,!policy,!winbox,!web,!sniff,!sensitive,!romon,!rest-api
/user add name=mikrodash group=mikrodash password=your-secure-password
Enabling TLS (API-SSL)
MikroDash supports encrypted connections to the RouterOS API over api-ssl (default port 8729). You can use a self-signed certificate — no external CA or purchased certificate is required.
Step 1 — Enable the API-SSL service
/ip/service set api-ssl disabled=no port=8729
Step 2 — Create and self-sign a local CA
/certificate add name=local-ca common-name=local-ca days-valid=3650 key-size=2048 key-usage=key-cert-sign,crl-sign
/certificate sign local-ca
Step 3 — Create and sign the API-SSL certificate using that CA
/certificate add name=api-ssl-cert common-name=mikrodash days-valid=3650 key-size=2048 key-usage=digital-signature,key-encipherment,tls-server
/certificate sign api-ssl-cert ca=local-ca
Step 4 — Apply the certificate to the service
/ip/service set api-ssl certificate=api-ssl-cert disabled=no port=8729
Once the certificate is applied, go to Settings → Routers, edit your router entry, enable TLS, enable Allow self-signed cert, set the port to 8729, and save. MikroDash will reconnect over an encrypted channel immediately.
Environment Variables
A .env file is not required. All router configuration, dashboard auth, and encryption keys are managed through the web UI and the Docker volume. The only reason to create a .env is to override infrastructure-level defaults:
# Port MikroDash listens on inside the container (default: 3081)
# PORT=3081

# Maximum simultaneous browser connections (default: 50)
# MAX_SOCKETS=50

# Trusted proxy IP for X-Forwarded-For (only needed behind a reverse proxy)
# TRUSTED_PROXY=127.0.0.1

# RouterOS API write timeout in milliseconds (default: 30000)
# ROS_WRITE_TIMEOUT_MS=30000

# Encryption key for credentials at rest — auto-generated if not set
# DATA_SECRET=your-long-random-string-here

# Verbose RouterOS debug logging — can also be toggled in Settings → Diagnostics
# ROS_DEBUG=false
Copy .env.example to .env, uncomment lines you need, and add env_file: .env to your docker-compose.yml.
Architecture
Streamed (router pushes continuously — no poll overhead)
| Data | RouterOS endpoint |
|---|---|
| System metrics (CPU, RAM, temp, uptime) | /system/resource/print =interval=N |
| WAN Traffic RX/TX per interface | /interface/monitor-traffic =interface=X =interval=1 |
| Ping RTT + loss | /tool/ping =address=X =interval=N |
| Top Talkers (Kid Control) | /ip/kid-control/device/print =interval=N |
| Interface metadata (name, IP, state) | /interface/print =interval=N + /ip/address/print =interval=N |
| Interface byte counters (all interfaces) | /interface/monitor-traffic =interface=all =interval=N |
| Firewall connection table, geo-IP | /ip/firewall/connection/print =interval=N |
| Router Logs | /log/listen |
| DHCP Lease changes | /ip/dhcp-server/lease/listen |
| Firewall structural changes (rule add/remove/edit) | /ip/firewall/filter|nat|mangle/listen |
| WireGuard peer handshakes & stats | /interface/wireguard/peers/listen |
| ARP table (device join/leave) | /ip/arp/listen |
| Route table (add/remove/change) | /ip/route/listen |
| BGP session state changes | /routing/bgp/session/listen |
Polled (concurrent via tagged API multiplexing)
| Collector | Default interval | Data |
|---|---|---|
| Bandwidth | 3 s | Per-connection live RX/TX/Total Mbps (reads from the shared connection-table cache populated by the Connections stream) |
| VPN counters | 5 s | WireGuard per-peer byte counter refresh for live rates |
| Firewall counters | 5 s | Packet/byte counter refresh for all firewall rules (RouterOS 7.x does not push counter updates via the listen stream) |
| Wireless | 30 s | Wireless client list |
| DHCP Networks | ~5 min | LAN subnets, pool sizes, WAN IP, internet-facing interfaces |
All collectors run concurrently on a single TCP connection — no serial queuing. All intervals are adjustable in the Settings page and apply immediately without restart.
Idle gating — all collectors (both polled and interval-streamed) skip data processing and API calls when no browser clients are connected. On an unattended dashboard, RouterOS API traffic drops to near zero across all data paths.
All collectors that support RouterOS /listen streams use event-driven delivery — RouterOS pushes only delta rows when data changes, producing zero API traffic when the network is idle. A 60-second heartbeat emit keeps the browser's stale-detection timers alive.
Keyboard Shortcuts
| Key | Page |
|---|---|
1 | Dashboard |
2 | Wireless |
3 | Interfaces |
4 | DHCP |
5 | VPN |
6 | Connections |
7 | Routing |
8 | Bandwidth |
9 | Firewall |
0 | Logs |
/ | Focus log search |
License
MIT — see LICENSE
Third-party attributions — see THIRD_PARTY_NOTICES
Disclaimer
MikroDash is an independent, community-built project and is not affiliated with, endorsed by, or associated with MikroTik SIA in any way. MikroTik and RouterOS are trademarks of MikroTik SIA. All product names and trademarks are the property of their respective owners.
Built With AI
The code for MikroDash was written with the assistance of Claude by Anthropic.