nettools
![]()
![]()
![]()
![]()
A suite of network diagnostic tools developed by Baidu's physical network black-box monitoring team, including:
- bitflip: Detects packet loss and bit-flip errors in large-scale physical networks.
- bitflip6: IPv6 variant of bitflip for IPv6 network diagnostics.
- baize: Configuration-driven continuous network quality monitoring tool for long-term deployment.
- kuiniu: GPU NIC interconnect probing tool for AI training clusters — symmetric RoCEv2/UDP probing across GPU pairs, with
role=bothsingle-process dual-role deployment. - lidar: TCP SYN probing tool for network reachability detection — no server-side deployment required.
- mping: Multi-target ICMP Echo ping tool with CIDR expansion, DNS resolution, hardware timestamping, and packet corruption detection.
- mping6: IPv6 variant of mping for ICMPv6 Echo probing with packet corruption detection.
- evr: VXLAN-based EVR device probing tool — embeds the real EVR src IP in the payload so reflected probes can be matched back without a 5-tuple key.
Produced by Baidu System Department
Installation
curl -fsSL https://nettools.rpcx.io/install.sh | sh
Or install to a specific directory:
BINDIR=~/.local/bin curl -fsSL https://nettools.rpcx.io/install.sh | sh
Or build from source:
make build
bitflip
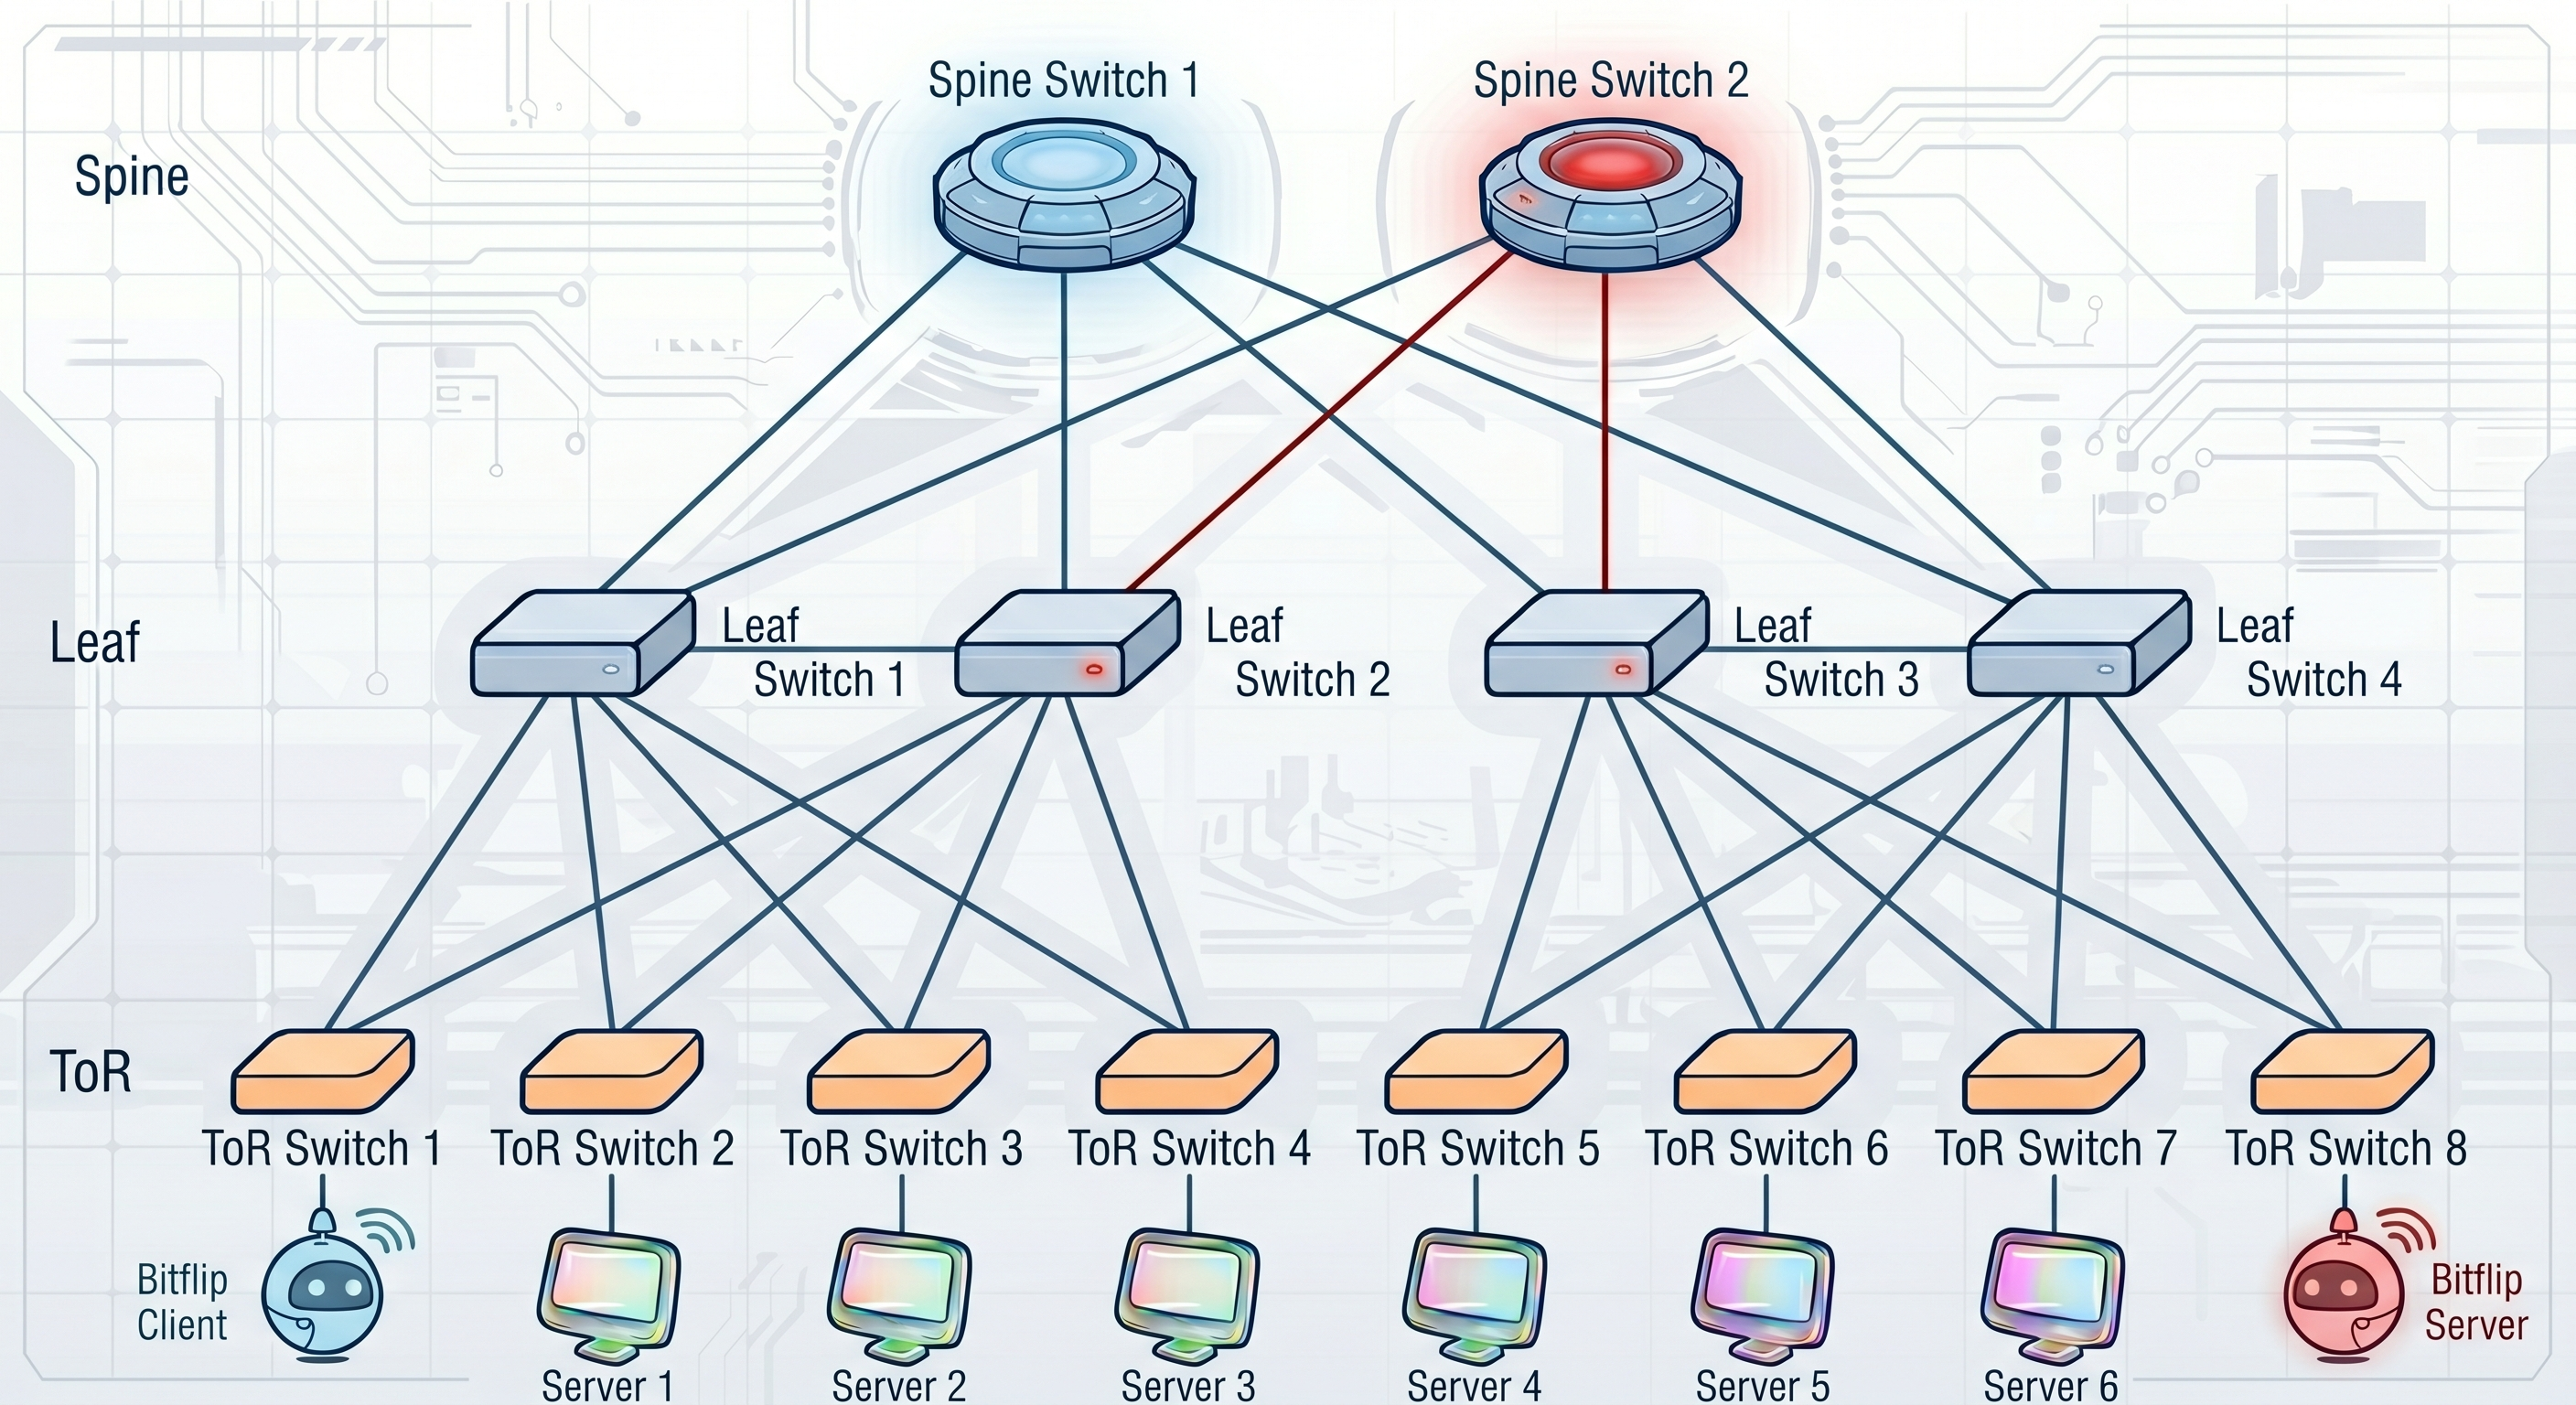
A high-frequency UDP probing tool for network bit-flip (packet corruption) and packet loss detection. Supports unidirectional loss and corruption detection — both client-side (round-trip) and server-side (one-way from client to server).
How it works: The client sends a large volume of UDP packets per second to the server, which echoes them back unchanged. Both sides independently detect issues:
- Client side (round-trip): Detects packet loss and bit-flip on the full round-trip path. If a packet was dropped in either direction, it is counted as loss. If bit-flip is detected in the returned payload, the five-tuple is logged.
- Server side (one-way): Detects packet loss and bit-flip on the client-to-server direction only. Each packet carries the client's actual send count and starting port pair for the previous time window; the server uses these to compute one-way loss and reconstruct the complete set of expected port pairs — enabling per-five-tuple loss identification without tracking client state. The server auto-registers unknown clients on first packet — no pre-configuration required.
By comparing client-side and server-side loss, you can determine whether loss occurs on the forward path (client → server) or the return path (server → client).
Quick Start
Build:
make build
Run server (on the remote host):
# Simplest — auto-detects local IP
./bitflip

# With explicit IP
./bitflip -r server -s <server_ip> -c <client_ip>
Run client (on the local host):
# -c auto-detected if empty, -s is required
./bitflip -r client -s <server_ip>

# With explicit IPs
./bitflip -r client -c <client_ip> -s <server_ip>
Command-line Flags
| Short | Long | Default | Description |
|---|---|---|---|
-r | --role | server | Role: client or server |
-c | --client-addr | "" | Client IP address (auto-detected if empty) |
-s | --server-addr | "" | Server IP address (auto-detected for server role if empty) |
-t | --tos | 64 | IP TOS/DSCP value |
-n | --count | 0 | Max packets to send (0 = unlimited) |
-d | --duration | 0 | Max send duration (0 = unlimited) |
--client-ports | "43500,43599" | Client port range [min,max] | |
--server-ports | "43500,43509" | Server port range [min,max] | |
--rate | 5000 | Packets per span | |
--msglen | 1024 | Message payload size (excluding 32-byte header) | |
--delay | 3s | Delay before processing stats (waiting for in-flight packets) | |
--verbose | false | Print per-port loss details on packet loss (both client and server) |
Examples
# Server side — auto-detect, no need to specify -c
# Server auto-registers unknown clients on first packet
./bitflip

# Client side
sudo ./bitflip -r client -s 10.0.0.2

# Client with custom rate and duration
sudo ./bitflip --role client --server-addr 10.0.0.2 --rate 10000 --duration 60s

# Client with verbose loss port details
sudo ./bitflip -r client -s 10.0.0.2 --verbose

# Server with verbose loss port details (per-five-tuple loss)
./bitflip -s 10.0.0.1 --verbose
Bit-flip Detection
The client sends packets padded with 4 salt patterns, selected by seq % 4:
| Index | Pattern | Description |
|---|---|---|
| 0 | 0xFF | All-ones byte |
| 1 | 0x00 | All-zeros byte |
| 2 | 0x5A | Fixed pattern 01011010 |
| 3 | Complementary alternating | 0xAAAA / 0x5555 alternating 16-bit words |
The server uses the same 4 salt patterns to validate packets, ensuring accurate identification of which bytes have been flipped.
Packet Format
+----------+----------+-----------+---------------+------------------+------------------+----------+
| Magic(8) | Seq(8)   | Ts(8)     | LastSent(4)   | LastSrcPort(2)   | LastDstPort(2)   | Salt(N)  |
+----------+----------+-----------+---------------+------------------+------------------+----------+
- Magic: 8-byte magic flag identifier
- Seq: 8-byte sequence number
- Ts: 8-byte nanosecond timestamp
- LastSent: 4-byte previous span send count
- LastSrcPort: 2-byte previous span starting source port
- LastDstPort: 2-byte previous span starting destination port
- Salt: N-byte padding data (for bit-flip detection)
Through this compact protocol design, the server can reconstruct every port pair from the previous span using (LastSrcPort, LastDstPort, LastSent) and the deterministic GetNextPorts algorithm — enabling server-side unidirectional loss detection with per-five-tuple granularity, without the server needing to track client-side send state.
bitflip6
IPv6 variant of bitflip. Usage is identical to bitflip, with IPv6 addresses:
# Server side
./bitflip6

# Client side
sudo ./bitflip6 -r client -s fd00::2
mping
A multi-target ICMP Echo ping tool for batch network quality inspection. Supports CIDR range expansion, DNS hostname resolution, hardware timestamping (Linux), high-rate probing, and packet corruption detection. mping6 is the IPv6 variant.
Key features:
- CIDR expansion: Pass a network prefix (e.g.
10.0.1.0/24) and mping automatically expands to all host addresses. IPv6 supports/112–/128prefixes with a--max-targetssafety cap. - DNS resolution: Pass hostnames and mping resolves them automatically (A records for mping, AAAA for mping6).
- Hardware timestamps: Enabled by default on Linux via
SO_TIMESTAMPINGfor nanosecond latency accuracy. Falls back to software timestamps on macOS. - Rate control: Built-in token bucket rate limiter for precise per-target pps control.
- Multi-target: Comma-separated IPs, CIDR ranges, and DNS hostnames can be mixed freely.
- Packet corruption detection: Detects bit-flip errors in ICMP reply payloads by embedding known salt patterns in each probe packet.
Quick Start
Build:
make compile
Run:
# Single target (default 100 pps)
sudo ./mping -T 10.0.0.2

# Multiple targets
sudo ./mping -T 10.0.0.2,10.0.0.3,10.0.0.4

# CIDR range — probe entire /24
sudo ./mping -T 10.0.1.0/24

# DNS hostname
sudo ./mping -T www.example.com

# High rate for 30 seconds
sudo ./mping -T 10.0.0.2 -r 1000 -d 30s

# IPv6
sudo ./mping6 -T fd00::2
Command-line Flags (mping)
| Short | Long | Default | Description |
|---|---|---|---|
-T | --targets | — | Target IPv4 addresses/CIDR/hostnames, comma-separated (required) |
-l | --local-addr | auto | Local IP address |
-I | --interface | auto | Outgoing interface name |
-z | --tos | 0 | IP TOS/DSCP value |
--ttl | 64 | IP TTL | |
-c | --count | 0 | Max packets per target (0 = unlimited) |
-d | --duration | 0 | Max send duration (0 = unlimited) |
--delay | 3s | Delay before processing stats | |
-t | --timeout | 1s | Socket read timeout |
-r | --rate | 100 | Packets per second per target |
-s | --size | 64 | ICMP payload size in bytes (min: 8) |
--verbose | false | Print per-reply ICMP details | |
--hwts | true | Enable hardware timestamping | |
--max-targets | 65536 | Max targets after CIDR/DNS expansion | |
-V | --version | false | Print version and exit |
mping6 has the same flags with IPv6 equivalents (e.g. --tc instead of --tos, --hlim instead of --ttl).
See mping usage guide for more details.
baize
A configuration-driven continuous network quality monitoring tool for long-term deployment. Unlike bitflip's command-line flag approach, baize uses a JSON config file and supports running both Client and Server in a single process.
Key features:
- Config-driven: All parameters managed via JSON config file, easy for automated deployment.
- Single-process dual-role: Run Client and Server together in one process.
- Log rotation: Built-in daily log rotation with automatic cleanup of expired files and symlink to the latest log.
- pprof integration: Built-in Go pprof HTTP server for runtime profiling.
- Graceful shutdown: Listens for SIGINT/SIGTERM and gracefully shuts down all goroutines.
The internal version of baize used in Baidu's physical network also supports periodically pulling configuration from a database and pushing data to Kafka for aggregation. The open-source version is simplified to use config files only and output to logs by default, but provides interfaces for custom implementations.
Use Cases
- Inter-cluster high-frequency probing: Continuous monitoring between large-scale clusters; high-frequency probing (default 5000 pps) quickly exposes intermittent packet loss; multi-port coverage of ECMP paths for pinpointing faulty links.
- LCC datacenter probing: Cross-LCC datacenter network quality monitoring; configuration-driven deployment across multiple datacenter nodes.
- ADC/DC network migration monitoring: Continuous monitoring during network equipment cutover and upgrades; before/after quality comparison to quantify migration impact; automatic detection of packet loss and corruption introduced by changes.
- Dedicated line monitoring: Carrier dedicated line quality monitoring; real-time alerts for loss and latency anomalies; data support for SLA evaluation.
- Failback verification: Network quality verification after traffic failback from disaster recovery; confirming no packet loss or bit-flip on the failback path.
- Ad-hoc point-to-point monitoring: Temporary end-to-end probing for troubleshooting; minimal configuration to get started (only requires both IPs); easy to stop after verification.
Quick Start
Build:
go build -o baize ./cmd/baize/
Create a config file (e.g., baize.json):
{
  "pprof_addr": ":6060",
  "log_dir": "/var/log/baize",
  "log_max_age_days": 7,
  "client": {
    "client_addr": "10.0.0.1",
    "server_addrs": "10.0.0.2",
    "rate_in_span": 5000,
    "span": "1s",
    "delay": "3s",
    "msg_len": 1024,
    "tos": 64
  },
  "server": {
    "server_addr": "10.0.0.2",
    "client_addrs": "10.0.0.1",
    "rate_in_span": 5000,
    "span": "1s",
    "delay": "3s",
    "msg_len": 1024,
    "tos": 64
  }
}
Run:
# Use default config file (baize.json)
sudo ./baize

# Specify config file path
sudo ./baize -c /etc/baize/baize.json
Config Reference
Top-level fields:
| Field | Type | Default | Description |
|---|---|---|---|
pprof_addr | string | "" | pprof HTTP listen address (e.g. :6060), empty to disable |
log_dir | string | "" | Log file directory, empty to output to stderr |
log_max_age_days | int | 7 | Log retention days (≤0 defaults to 7) |
client | object | null | Client config, null to skip |
server | object | null | Server config, null to skip |
Client/Server fields:
| Field | Type | Default | Description |
|---|---|---|---|
client_addr / server_addr | string | "" | Local IP address |
server_addrs / client_addrs | string | "" | Remote IP address(es), comma-separated |
tos | int | 0 | IP TOS/DSCP value |
client_port_range | string | "" | Client port range min,max |
server_port_range | string | "" | Server port range min,max |
rate_in_span | int64 | 0 | Packets per span |
span | string | "0s" | Stats time window (Go duration) |
delay | string | "0s" | Stats processing delay |
msg_len | int | 0 | Message payload size (excluding 32-byte header) |
count | int | 0 | Max packets to send, client only (0 = unlimited) |
send_duration | string | "0s" | Max send duration, client only (0 = unlimited) |
verbose | bool | false | Print per-port loss details |
See baize usage guide for more details.
kuiniu
A GPU NIC interconnect probing tool for AI training clusters. Probes RoCEv2/UDP paths between GPU NICs across nodes, organized by GPU pairs (local_gpu_addrs[i] ↔ remote_gpu_addrs[i]). A single process can run client and server simultaneously via role=both, so every training node ships an identical config.
Key features:
- GPU NIC binding: Each probe is sourced from a specific GPU NIC IP — covers the real RoCEv2 paths used by training traffic, attributing loss precisely to direction.
- GPU pair model: Parallel arrays
local_gpu_addrs[i]↔remote_gpu_addrs[i]expand to N symmetric probe pairs in one shot, matching multi-GPU-per-node deployments naturally. - role=both single-process dual-role: One JSON config +
role=bothruns client + server in the same process. The server keeps alocalGPUSetto drop self-echoed packets, so all nodes can ship the exact same config. - 4-Salt bit-flip detection: Reuses baize's 4-pattern salt scheme to catch the complementary bit flips that TCP/UDP checksums miss on RoCE links.
- Shared logging utility: Daily-rotated logs via
util.RotateWriter(shared with baize), output to both terminal and file.
Quick Start
Build:
go build -o kuiniu ./cmd/kuiniu/
Create a config file (e.g., kuiniu.json):
{
  "pprof_addr": ":6060",
  "log_dir": "/var/log/kuiniu",
  "log_max_age_days": 7,
  "role": "both",
  "local_gpu_addrs": [
    "33.0.1.25", "33.0.1.26", "33.0.1.153", "33.0.1.154"
  ],
  "remote_gpu_addrs": [
    "33.0.2.27", "33.0.2.28", "33.0.2.155", "33.0.2.156"
  ],
  "tos": 64,
  "client_port_range": "43600,43699",
  "server_port_range": "44600,44609",
  "rate_in_span": 5000,
  "span": "1s",
  "delay": "3s",
  "msg_len": 1024
}
Run:
# Use a JSON config (CLI flags override config values)
sudo ./kuiniu -c kuiniu.json

# Pure CLI mode (single GPU pair)
sudo ./kuiniu --role both \
  --local-gpu  33.0.1.25 \
  --remote-gpu 33.0.2.27
Command-line Flags
| Short | Long | Default | Description |
|---|---|---|---|
-r | --role | "" | Role: client, server, or both |
--local-gpu | "" | Comma-separated local GPU IP addresses | |
--remote-gpu | "" | Comma-separated remote GPU IP addresses | |
-t | --tos | 64 | IP TOS/DSCP value |
-n | --count | 0 | Max packets per GPU pair (0 = unlimited) |
-d | --duration | 0 | Max send duration (0 = unlimited) |
--client-ports | "43600,43699" | Client port range [min,max] | |
--server-ports | "43600,43609" | Server port range [min,max] | |
--rate | 5000 | Packets per span across all GPU pairs | |
--msglen | 1024 | Payload size (excluding 44-byte header) | |
--delay | 3s | Delay before processing stats | |
--verbose | false | Print per-port loss details | |
-c | --config | "" | JSON config file path (CLI flags override config values) |
--pprof | "" | pprof listen address (e.g. :6060) | |
--log-dir | "" | Log directory for rotated log files | |
--log-max-age | 7 | Max days to keep log files |
Use Cases
- AI training cluster GPU interconnect monitoring: Continuous probing across GPU NICs in large training clusters, exposing RoCE loss before it stalls a training job.
- RoCEv2 link loss localization: Symmetric probes per GPU pair attribute loss to the forward or return path.
- GPU NIC bit-flip troubleshooting: Catch complementary flips that TCP/UDP checksums miss.
- Pre-training health check: Quick GPU-to-GPU connectivity validation before launching a training run.
- Post-incident review: Replay symmetric probe data to localize faulty NICs/switches.
See kuiniu usage guide for more details.
lidar
A TCP SYN probing tool for network reachability detection. It sends raw TCP SYN packets to target IPs and classifies responses as available (SYN-ACK), denied (RST), or unreachable (timeout). No server-side deployment needed — it leverages the target host's kernel TCP stack to respond to SYN packets.
How it works: lidar constructs raw IP + TCP SYN packets via raw sockets, sends them to target IPs, and captures responses via BPF devices (macOS) or raw sockets (Linux). The kernel TCP stack does not process these packets, so existing TCP connections are unaffected.
Key features:
- No server needed: Only requires target IP + port. The target kernel automatically responds to SYN — no software installation required on the remote side.
- Precise classification: Distinguishes SYN-ACK (port open), RST (port closed/rejected), and timeout (unreachable/packet loss).
- Source port rotation: Automatically rotates source ports across a configurable range to cover multiple ECMP paths.
- Rate limiting: Built-in token bucket rate limiter for precise probing frequency control.
- Multi-target: Supports comma-separated target IPs with independent per-target statistics.
Quick Start
Build:
go build -o lidar ./cmd/lidar/
Run:
# Probe a single target on port 80 (default 10 pps)
sudo ./lidar -t 10.0.0.2 -p 80

# Probe multiple targets
sudo ./lidar -t 10.0.0.2,10.0.0.3,10.0.0.4 -p 22

# High rate probing for 30 seconds
sudo ./lidar -t 10.0.0.2 -p 80 --rate 100 -d 30s

# Send exactly 1000 probes
sudo ./lidar -t 10.0.0.2 -p 80 -n 1000

# Verbose mode with per-port loss details
sudo ./lidar -t 10.0.0.2 -p 80 -v
Command-line Flags
| Short | Long | Default | Description |
|---|---|---|---|
-t | --targets | — | Target IP addresses, comma-separated (required) |
-p | --port | 22 | Target TCP port |
-l | --local-addr | auto | Source IP address |
--local-port | 54321 | Source port base | |
--local-port-count | 100 | Number of source ports for rotation | |
--rate | 10 | Packets per second (pps) | |
-s | --span | 1s | Stats reporting interval |
--delay | 3s | Delay before first stats report | |
-n | --count | 0 | Max packets to send (0 = unlimited) |
-d | --duration | 0 | Max send duration (0 = unlimited) |
-i | --interface | auto | Outgoing interface name |
-v | --verbose | false | Print per-port loss details |
Output
2026/06/05 21:37:14 [INFO] probing 1 target(s) on port 80 from 192.168.1.14 (rate: 10 pps)
2026/06/05 21:37:14 [INFO] bound BPF to en0 (DLT=1)
2026/06/05 21:37:17 [WARN] 21:37:14, [192.168.1.14 -> 74.48.173.243], sent: 10, received: 10 (SYN-ACK: 10, RST: 0), timeout: 0
2026/06/05 21:37:18 [INFO] 21:37:15, [192.168.1.14 -> 74.48.173.243], sent: 10, received: 10 (SYN-ACK: 10, RST: 0), timeout: 0
| Field | Description |
|---|---|
sent | Total probe packets sent in this time window |
received | Total responses received |
SYN-ACK | SYN-ACK responses (target port open) |
RST | RST responses (target port closed/rejected) |
timeout | No response (unreachable/packet loss) |
See lidar usage guide for more details.
evr
A VXLAN-based probing tool for EVR (edge virtual router) devices. evr leverages the EVR's own VXLAN reflection capability — the probe machine constructs a UDP/VXLAN packet whose inner Ethernet/IPv4/UDP frame has its inner src and dst IP both set to the local probe IP, then embeds the real EVR src IP inside the payload so reflected probes can be matched back to the originating target without a 5-tuple key. No server-side process required — the EVR device itself does the reflecting.
How it works: The probe builds the outer IPv4 header itself via ipv4.NewRawConn (so mock_src source-IP spoofing is honored), wraps a VXLAN header + inner Ethernet/IPv4/UDP frame whose inner src/dst both equal the local IP, and writes the EVR's real src IP into payload bytes [24:28]. When the EVR reflects the inner frame, it lands directly on the local probe socket; a peerByEVRSrc map attributes each response back to the right target. A BPF prefilter on the read socket matches by inner UDP dst port + IPv4 TOS to drop unrelated traffic cheaply.
Key features:
- Self-loop inner frame: Inner src == inner dst == local IP, so EVR reflection lands on the probe socket without extra routing or remote-side software.
- Payload-embedded EVR src IP: Real EVR src IP at payload[24:28] enables single-socket multi-target probing with response-to-target attribution via
peerByEVRSrc. mock_srcsource-IP spoofing:IP_HDRINCLviaipv4.NewRawConnlets you forge the outer src IP per-target — useful for validating EVR forwarding policy across source addresses.- 4-Salt bit-flip detection: Reuses baize/kuiniu's 4-pattern salt scheme to catch flips that VXLAN/UDP checksums miss.
- JSON config + CLI override: Same operations pattern as baize/kuiniu — JSON file is authoritative, CLI flags override only what you set explicitly (
pflag.Visit). - Daily log rotation + pprof: Shared
util.RotateWriterand built-in pprof endpoint.
Quick Start
Build:
go build -o evr ./cmd/evr/
Create a config file (e.g., evr.json):
{
  "id": "evr-probe-1",
  "client_addr": "203.0.113.10",
  "targets": "198.51.100.96#192.0.2.1#203.0.113.99,198.51.100.97#192.0.2.2#203.0.113.99",
  "dst_port": 4789,
  "inner_dst_port": 8972,
  "src_mac": "00:00:00:00:ff:ff",
  "dst_mac": "00:00:5e:00:01:ff",
  "vni": 15990000,
  "tos": 64,
  "ttl": 64,
  "client_port_range": "63000,63999",
  "rate_in_span": 2000,
  "span": "1s",
  "delay": "5s",
  "msg_len": 1024,
  "log_dir": "./log",
  "log_max_age_days": 3
}
Each target is vtep#evrSrc[#mockSrc]:
vtep: outer destination IP (the EVR VTEP).evrSrc: real EVR source IP, embedded into the payload for response matching.mockSrc(optional): outer source IP to spoof; defaults toclient_addr.
Run:
# Use a JSON config (CLI flags override config values)
sudo ./evr -c evr.json

# Pure CLI mode (single target)
sudo ./evr --client-addr 203.0.113.10 \
  --targets 198.51.100.96#192.0.2.1
Command-line Flags
| Short | Long | Default | Description |
|---|---|---|---|
-c | --config | "" | JSON config file path (CLI flags override config values) |
--id | "" | Free-form agent identifier (used in logs) | |
--client-addr | auto | Local IPv4 used as the outer source (auto-detected if empty) | |
-t | --targets | — | Comma-separated targets in vtep#evrSrc[#mockSrc] form |
--dst-port | 4789 | Outer UDP destination port | |
--inner-dst-port | 8972 | Inner UDP destination port | |
--src-mac | 00:00:00:00:ff:ff | Inner Ethernet source MAC | |
--dst-mac | 00:00:5e:00:01:ff | Inner Ethernet destination MAC | |
--vni | 15990000 | VXLAN Network Identifier | |
--tos | 0 | IPv4 TOS/DSCP applied on outer and inner IP layers | |
--ttl | 64 | IPv4 TTL applied on outer and inner IP layers | |
--client-port-range | "9981,9981" | Outer source UDP port range, e.g. 63000,63999 | |
--rate-in-span | 1 | Probe packets per span across all targets | |
-s | --span | 100ms | Statistics reporting interval |
--delay | 100ms | Delay before finalising a stats bucket | |
--msg-len | 28 | Inner UDP payload length in bytes (header + salt) | |
--pprof | "" | pprof listen address (e.g. :6060) | |
--log-dir | "" | Log directory for rotated log files | |
--log-max-age | 3 | Max days to keep log files | |
-v | --verbose | false | Print per-port loss details |
-V | --version | false | Print version and exit |
Use Cases
- EVR device health monitoring: Continuous probing of EVR devices via their own VXLAN reflection — single-machine deployment, no remote software required.
- VXLAN tunnel path monitoring: Detect loss and bit-flip on the outer VXLAN tunnel path to/from the EVR.
- Multi-EVR concurrent comparison: One probe process covers many EVRs (each with its own
vtep#evrSrcpair);peerByEVRSrckeeps per-target stats clean. - NIC bit-flip detection on virtual networks: 4-Salt scheme exposes complementary flips that VXLAN/UDP checksums miss.
See evr usage guide for more details.
Testing
make test
Test Coverage

Contributing
See CONTRIBUTING.md for guidelines.
Security
See SECURITY.md for vulnerability reporting.
License
This project is licensed under the MIT License.