agtop
Run with:
npx @ldegio/agtop
Your window into what your AI coding agents are doing, sitting in the terminal, where you run them. agtop is a top-style terminal dashboard that tracks every Claude Code and Codex session on your machine: spend, token usage, context pressure, CPU load, tool invocations, and more. All in one place, live.


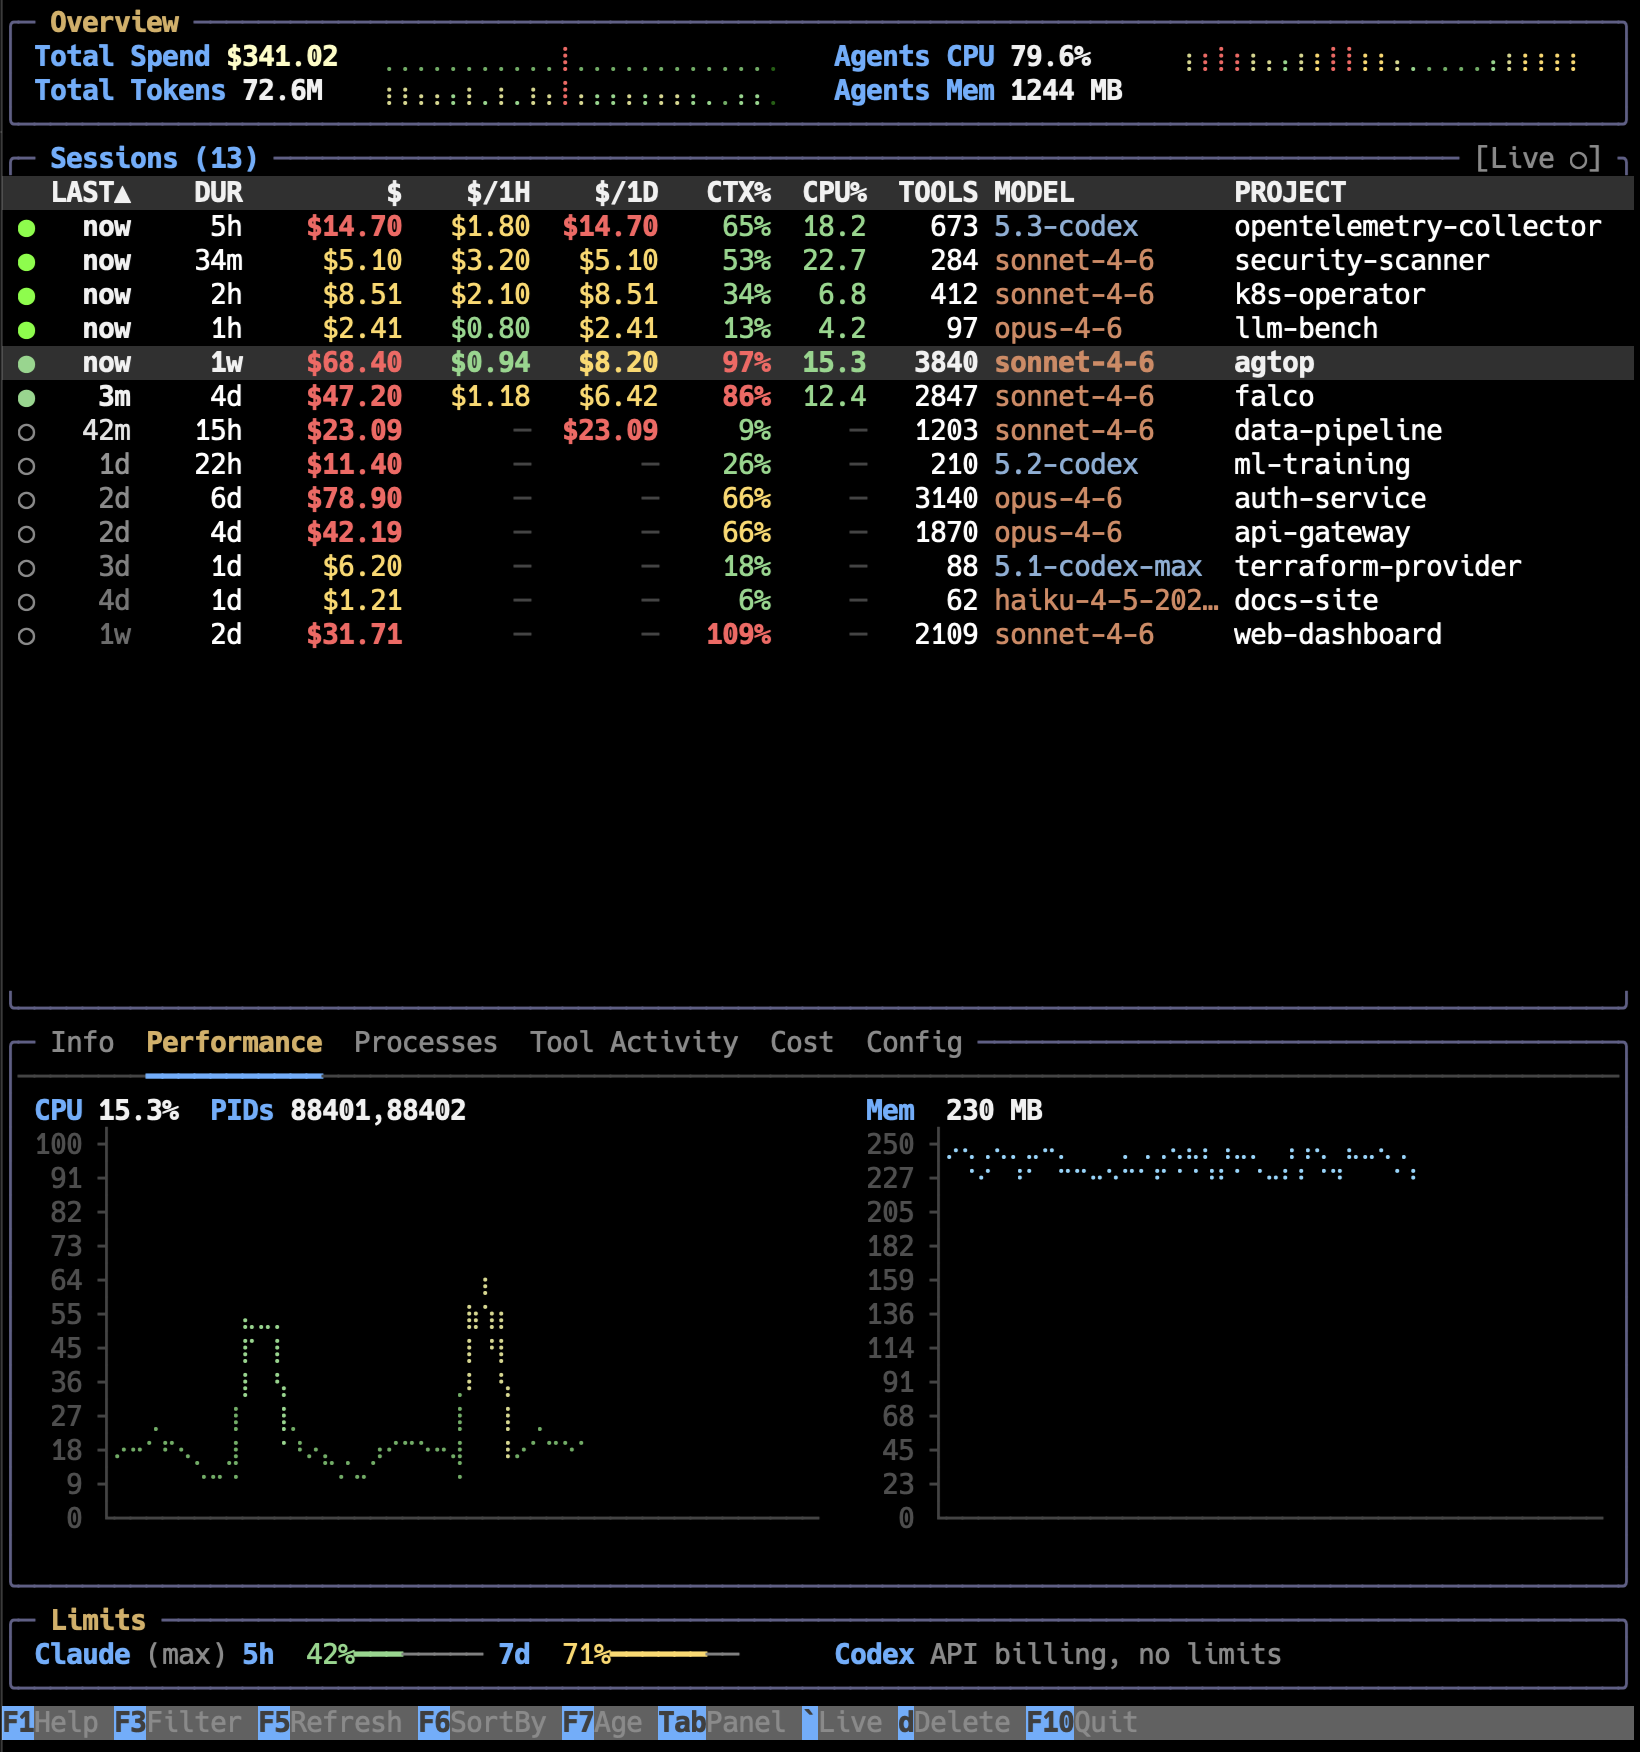
Features
- Session discovery -- automatically finds Claude Code (
~/.claude/projects/) and Codex (~/.codex/sessions/) sessions - Cost tracking -- per-session spend with hourly and daily breakdowns; plan-aware billing (retail, Max, included)
- Context pressure -- CTX% shows how full each agent's context window is
- Live toggle -- filter to running sessions with real-time CPU%, cost rates, and incremental tool counts
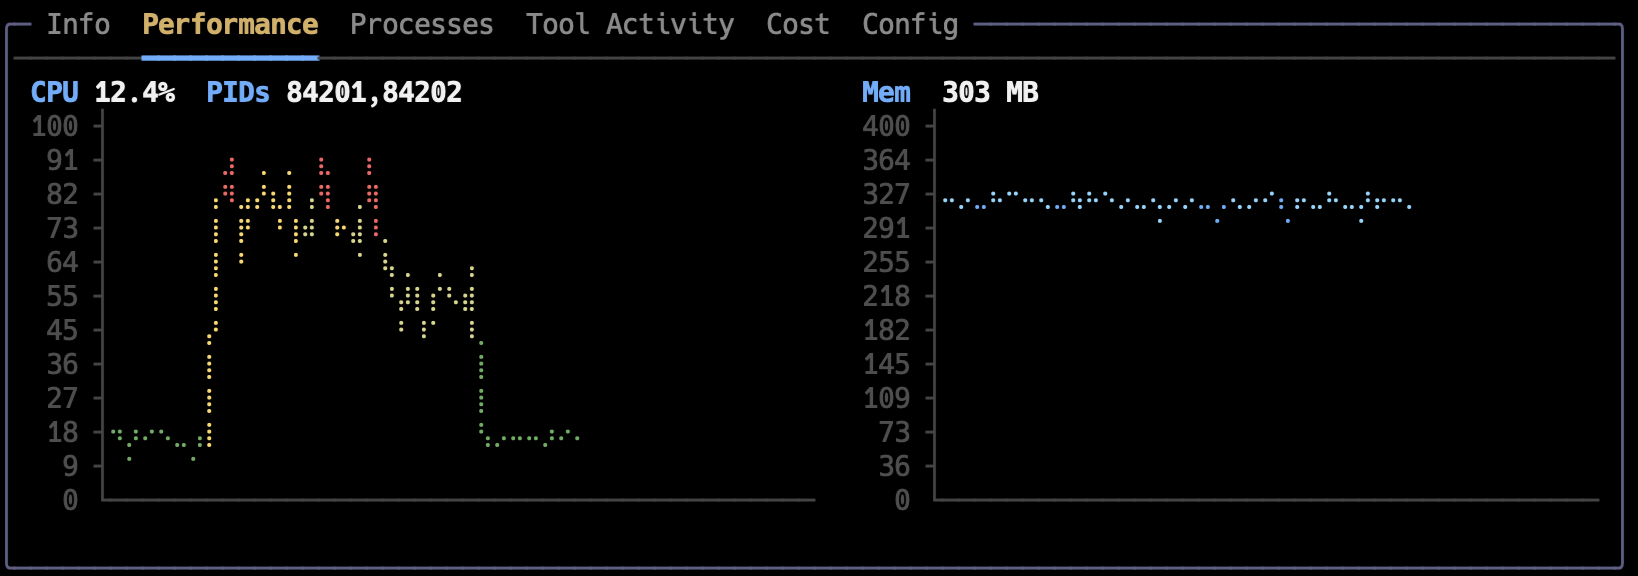
- Performance panel -- per-session CPU and memory sparkline charts over time
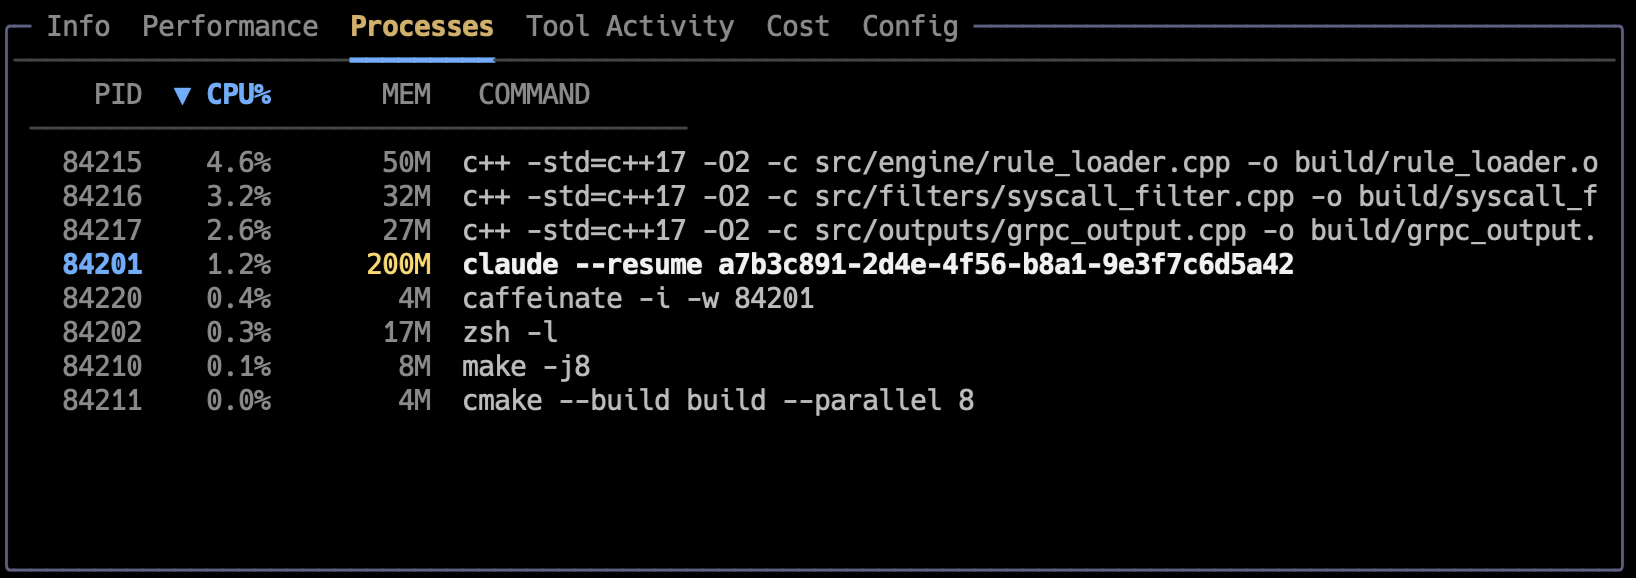
- Processes panel -- live process tree showing child processes with CPU%, memory, and command lines
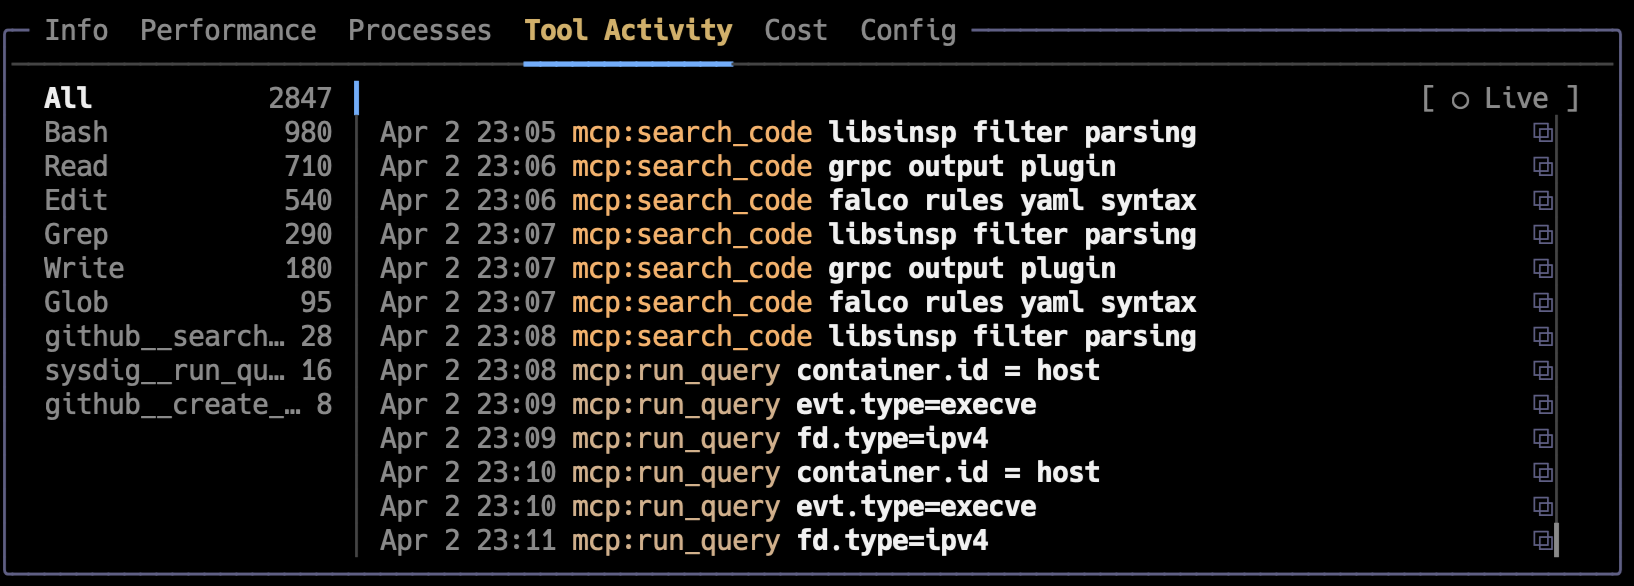
- Tool Activity panel -- scrollable per-tool invocation history with timestamps; see exactly what each agent has been doing
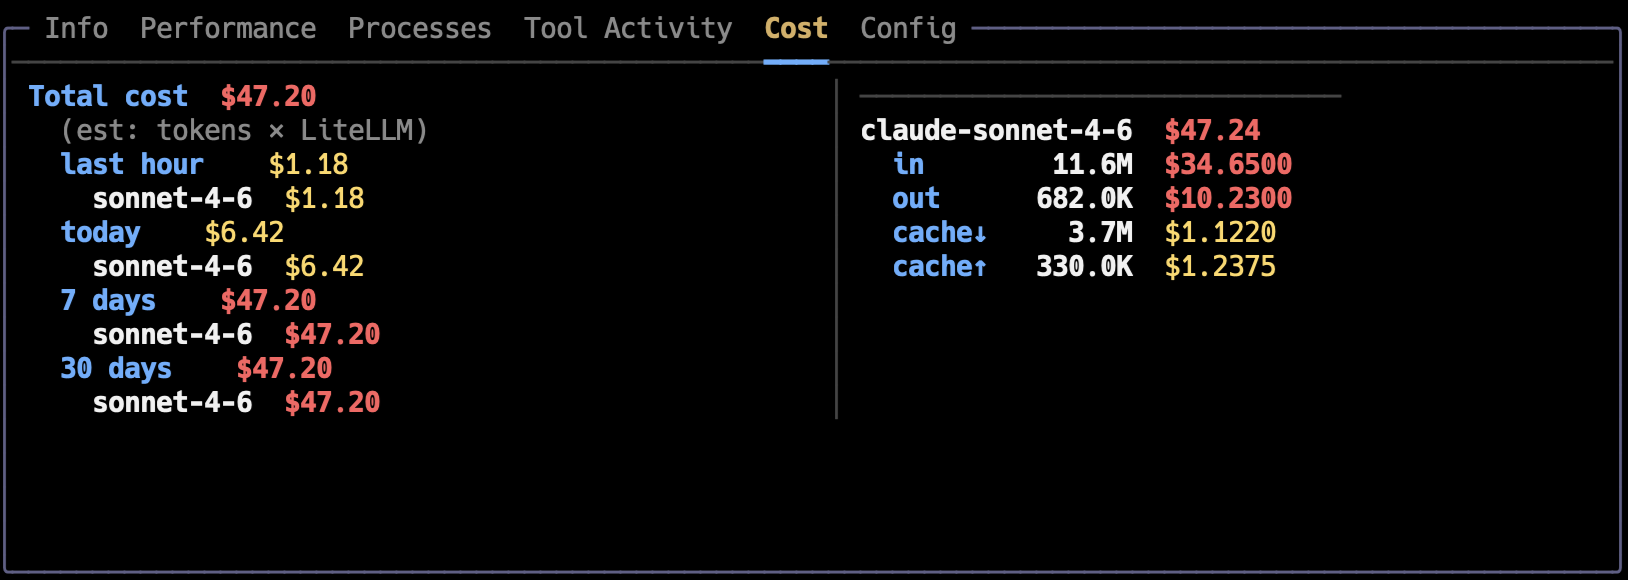
- Cost panel -- total spend by time window with per-model token and cost breakdown
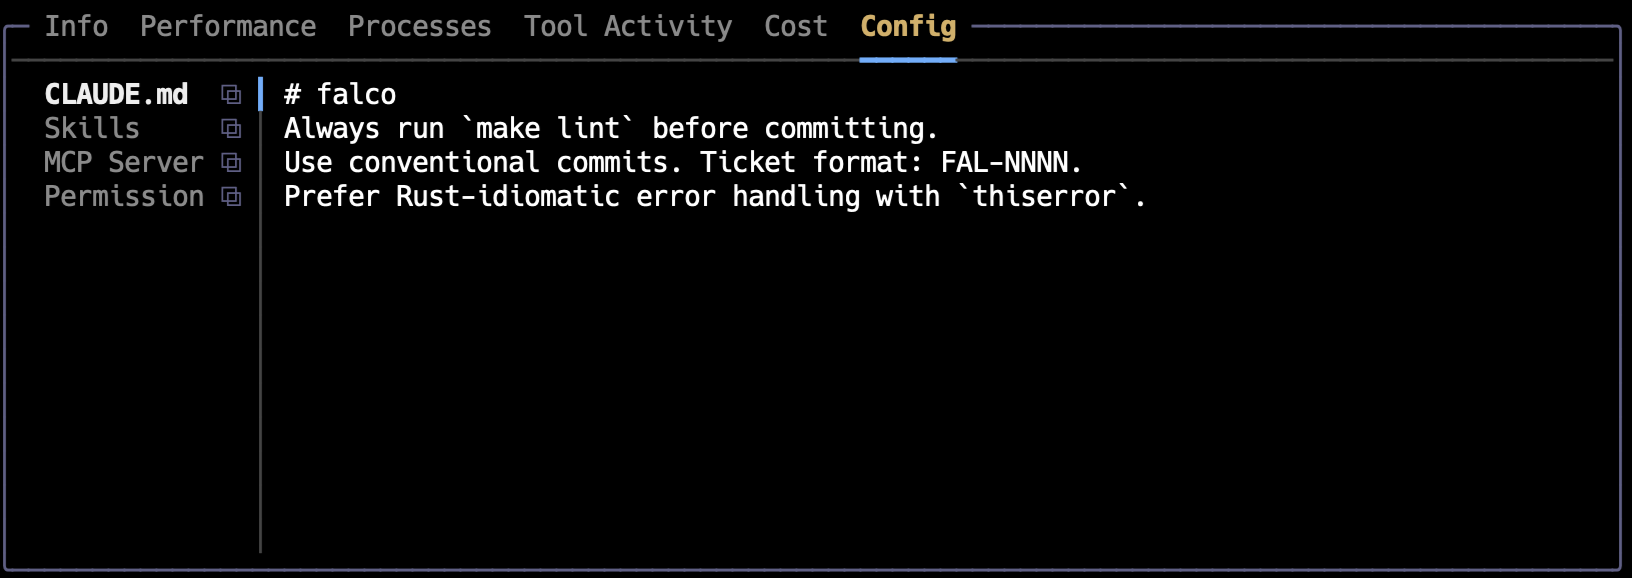
- Config panel -- browse CLAUDE.md/AGENTS.md, memories, skills, MCP servers, and permissions per session
- Subagents panel -- list the subagents a session dispatched (type, model, description, cost, tools, duration); includes "ghost" rows reconstructed from the parent transcript when Claude Code has purged the subagent's own jsonl. Expand a session row in the list to inspect or drill into each subagent.
- OS process metrics -- CPU% and PID count for running sessions (macOS/Linux/Windows)
- Overview sparklines -- aggregate spend, tokens, and CPU charts at a glance
- Detail view -- full cost breakdown, token split, per-model stats, and complete tool history
- Session management -- delete non-running sessions with confirmation
- Inactivity filter -- filter sessions by age (1 day, 1 week, 1 month)
- Mouse support -- click to select, sort by column, switch tabs; hover tooltips on column headers
- Non-interactive modes -- table and full JSON dump for scripting
Setup
The npx command at the top of this page runs agtop without installing it. To install it permanently so agtop is always available in your terminal:
npm install -g @ldegio/agtop
agtop
npm uninstall -g @ldegio/agtop
Requires Node.js >= 18. No other dependencies.
Options
| Flag | Description |
|---|---|
-l, --list | List sessions in a table and exit |
-j, --json | Dump full session data as JSON and exit |
-p, --plan <plan> | Billing plan for cost display (default: retail) |
-d, --delay <secs> | Refresh interval in seconds (default: 2) |
-h, --help | Show help |
Keyboard Shortcuts
| Key | Action |
|---|---|
j/k or arrows | Navigate sessions |
Enter | Open detail view |
Tab | Cycle bottom panel tabs |
Shift+Tab or ` | Toggle Live filter |
1-7 | Switch to Info/Performance/Processes/Tool Activity/Subagents/Cost/Config panel |
→ / Enter | Expand a session's subagents in the list; on a subagent row, the bottom panels show its data |
← | Collapse a session's expanded subagents |
F1, ?, h | Show help |
F3 or / | Search/filter sessions |
F5 or r | Force refresh |
F6 or > | Sort-by panel |
F7 | Filter sessions by age (1d/1w/1mo) |
P/M/T | Sort by Status/Memory/Cost |
d | Delete selected session (non-running only) |
q or F10 | Quit |
JSON Output
agtop -j dumps comprehensive session data including:
- Session identity (provider, ID, project, model)
- Cost breakdown (total, per-category, hourly/daily rates)
- Token counts (input, output, cached, detailed splits)
- Activity metrics (tool invocations by name, skills, web fetches/searches, MCP calls)
Screenshots
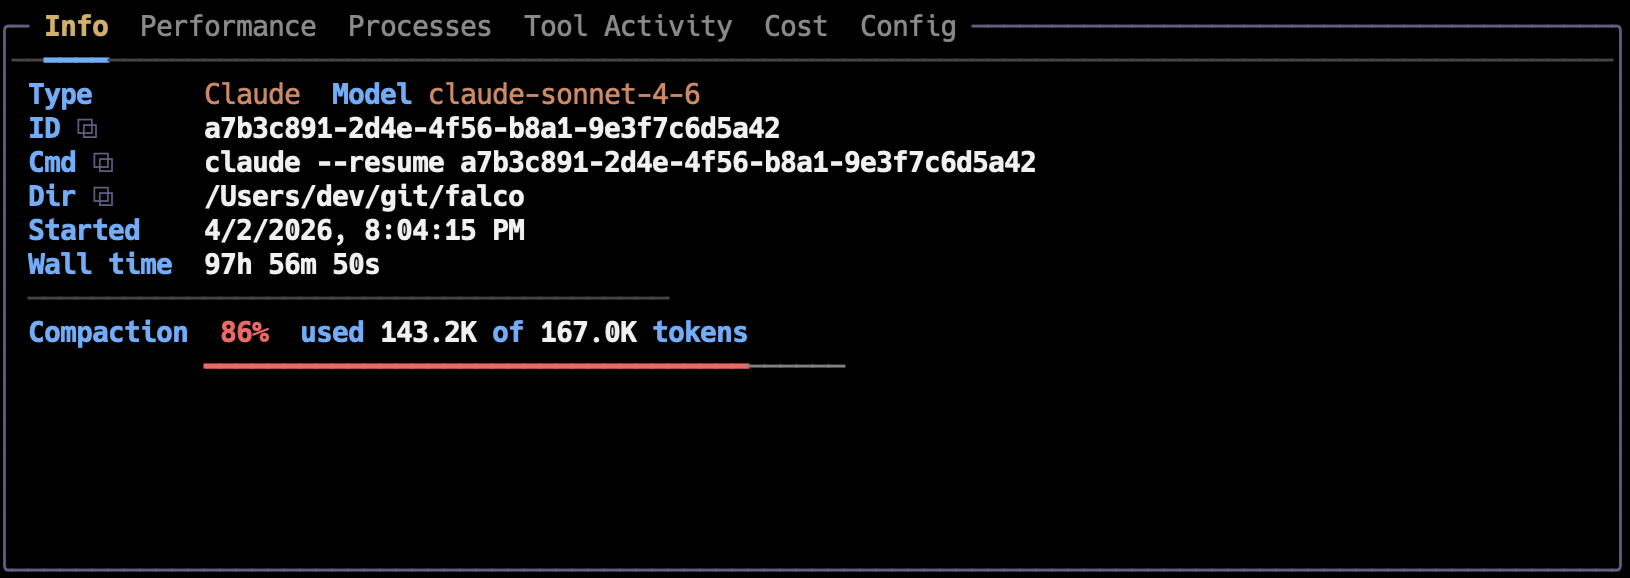
Info panel: session identity, wall/API time, context pressure
Performance: per-session CPU and memory sparkline charts over time
Processes: live process tree with CPU%, memory, and command lines (C++ builds, caffeinate, etc.)
Tool Activity: per-tool invocation counts and live feed with timestamps
Cost breakdown: total spend by time window, per-model token and cost split
Config: browse CLAUDE.md, memories, skills, MCP servers, and permissions
How It Works
agtop reads JSONL transcript files written by Claude Code and Codex to extract token counts, tool invocations, and model information. It fetches current model pricing from LiteLLM (cached for 24 hours) to compute cost estimates. For running sessions, it uses ps and lsof to map OS processes back to sessions and collect CPU/memory metrics.