prettymaps
A minimal Python library to draw customized maps from OpenStreetMap created using the osmnx, matplotlib, shapely and vsketch packages.





This work is licensed under a GNU Affero General Public License v3.0 (you can make commercial use, distribute and modify this project, but must disclose the source code with the license and copyright notice)
Note about crediting and NFTs:
- Please keep the printed message on the figures crediting my repository and OpenStreetMap (mandatory by their license).
- I am personally against NFTs for their environmental impact, the fact that they're a giant money-laundering pyramid scheme and the structural incentives they create for theft in the open source and generative art communities.
- I do not authorize in any way this project to be used for selling NFTs, although I cannot legally enforce it. Respect the creator.
- The AeternaCivitas and geoartnft projects have used this work to sell NFTs and refused to credit it. See how they reacted after being exposed: AeternaCivitas, geoartnft.
- I have closed my other generative art projects on Github and won't be sharing new ones as open source to protect me from the NFT community.



As seen on Hacker News:

prettymaps subreddit
Tutorial (marimo) · Google Colaboratory Demo
Installation
Install locally:
Install prettymaps with:
pip install prettymaps
Install on Google Colaboratory:
Install prettymaps with:
!pip install -e "git+https://github.com/marceloprates/prettymaps#egg=prettymaps"
Then restart the runtime (Runtime -> Restart Runtime) before importing prettymaps
Run front-end
After prettymaps is installed, you can run the front-end (streamlit) application from the prettymaps repository using:
streamlit run app.py
Tutorial
The full tutorial is at docs/tutorial.md — a markdown walkthrough with rendered images, the [Plot] dataclass fields, the layers/style parameters, presets, multiplot, hillshade, and keypoints.
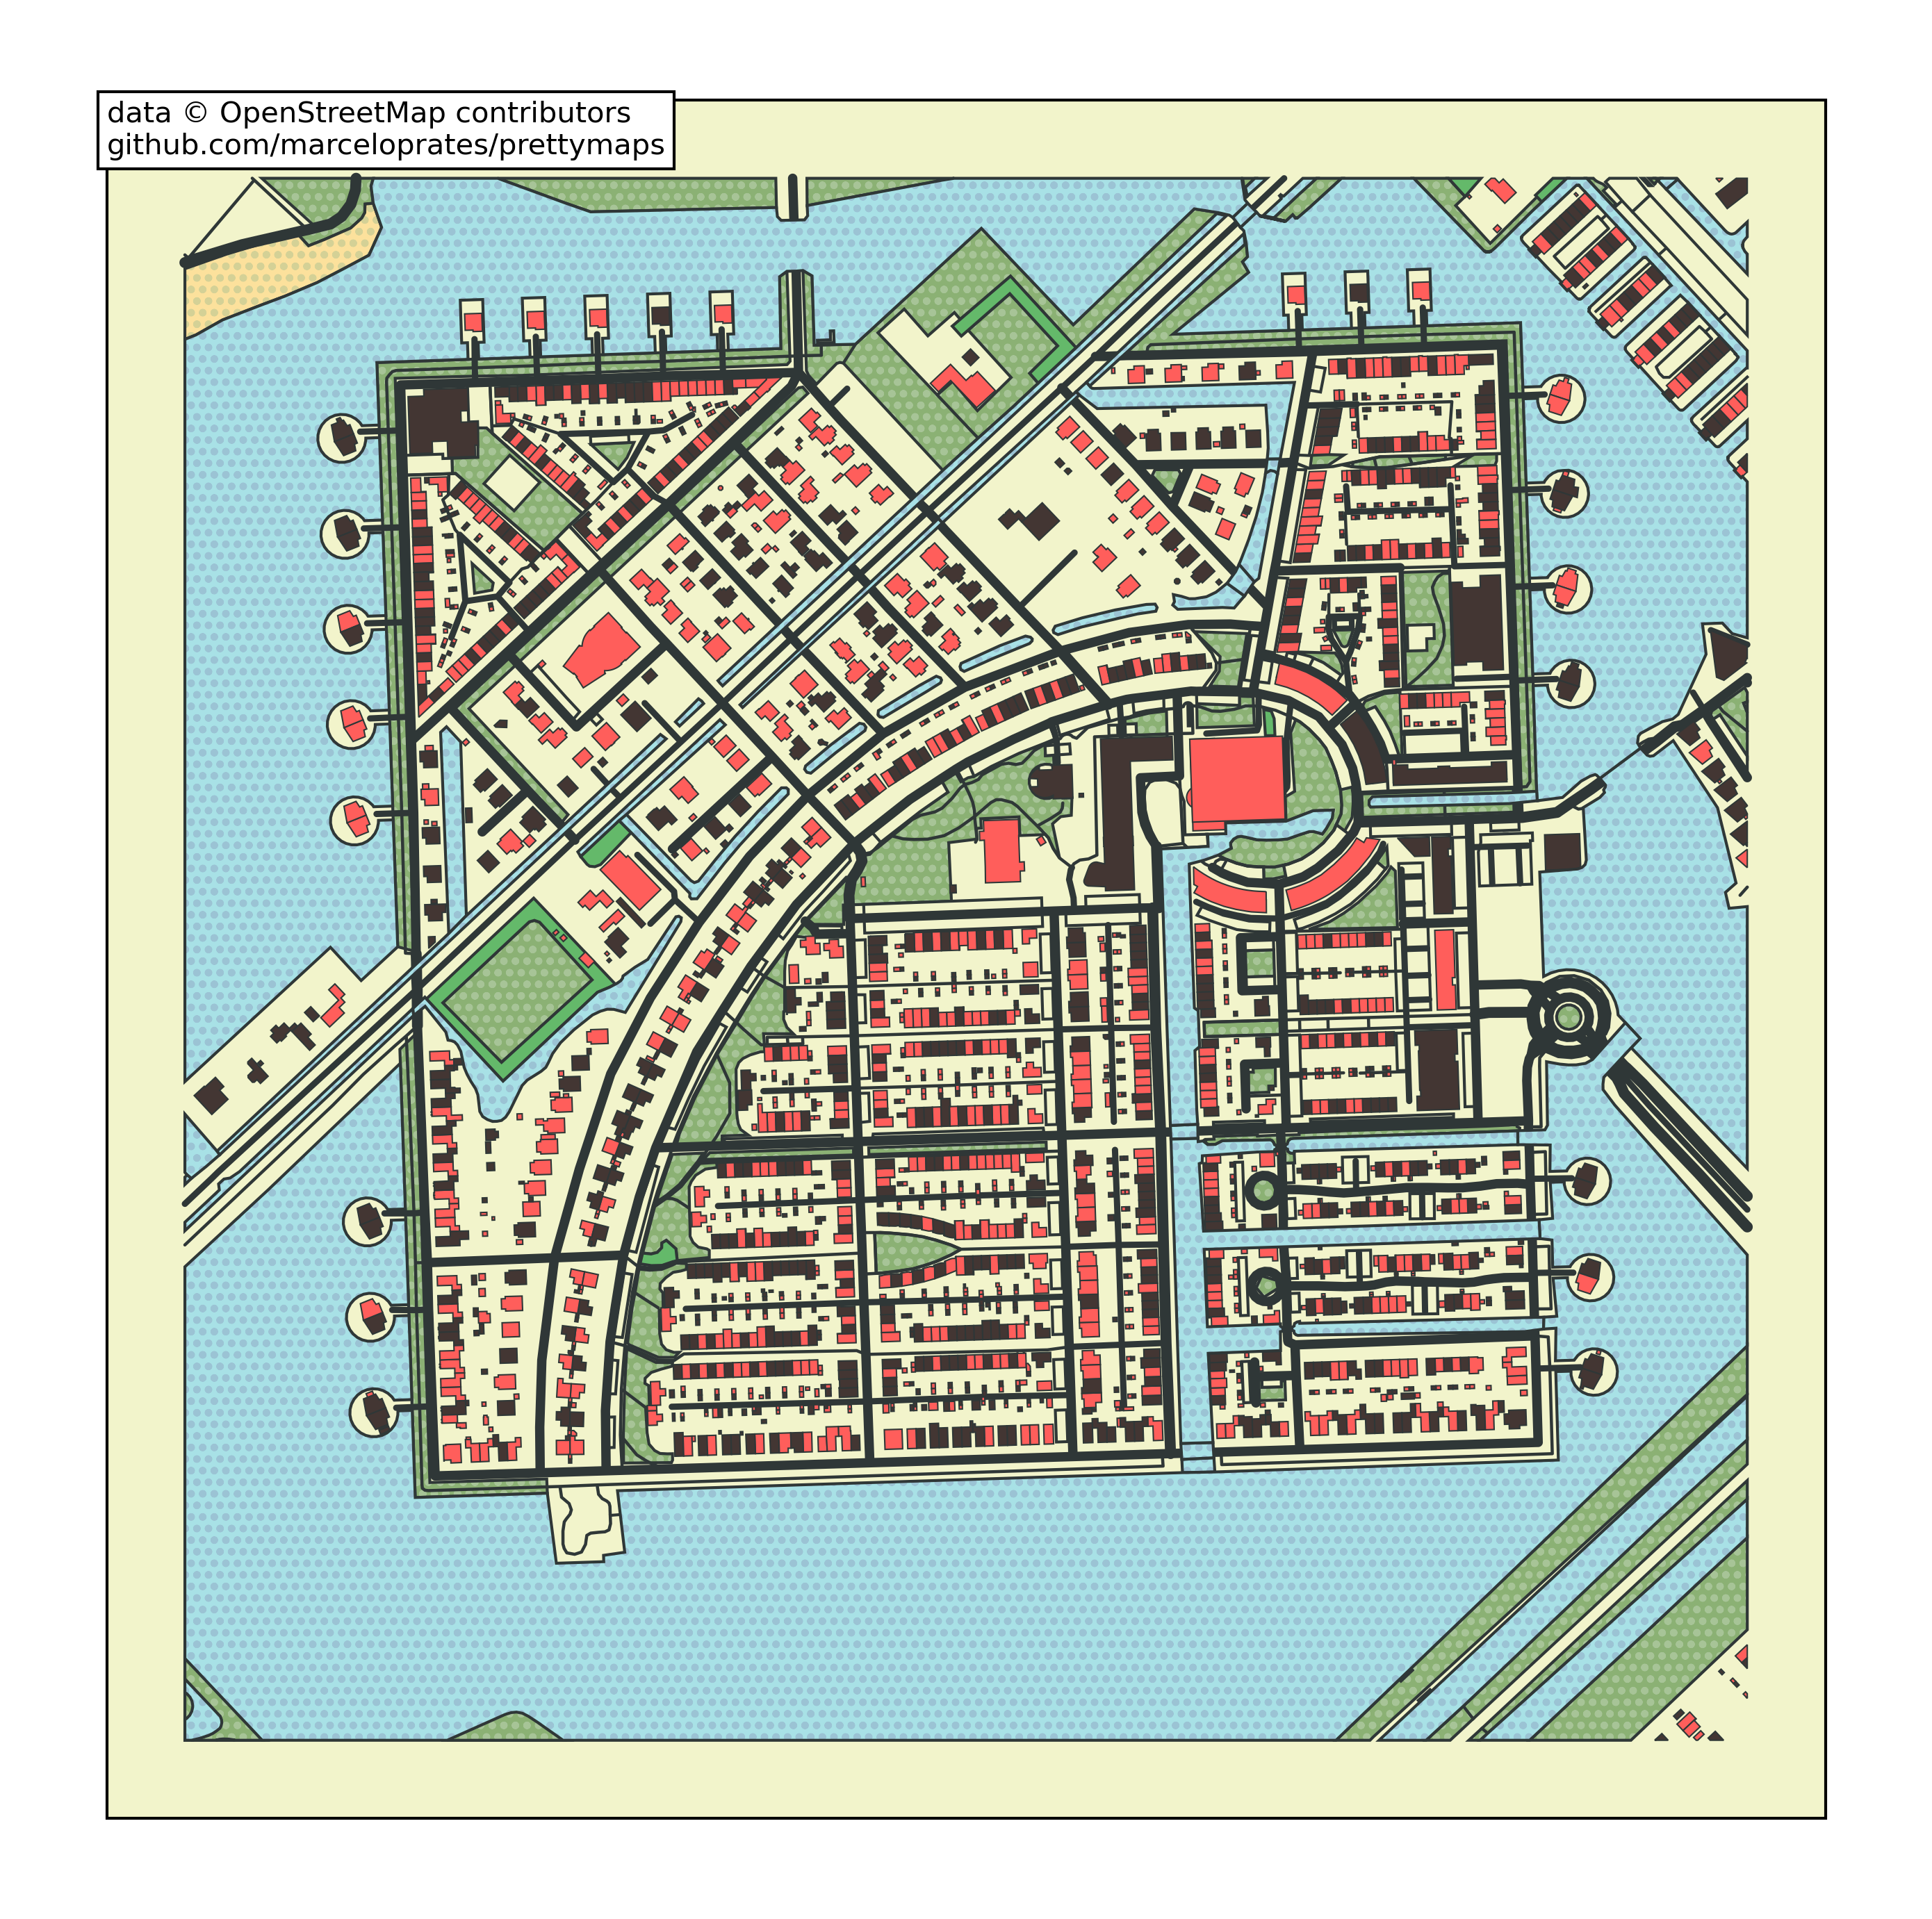
Quick start:
import prettymaps

plot = prettymaps.plot('Stad van de Zon, Heerhugowaard, Netherlands')| Resource | Where to find it |
|---|---|
| Full tutorial (markdown + images) | docs/tutorial.md |
| Interactive marimo notebook (runnable) | notebooks/tutorial.py |
| Open in Google Colab | Open in Colab |
| Streamlit front-end | streamlit run app.py |
Run the tutorial locally (marimo)
# Install marimo (already in requirements.txt)
pip install marimo

# Open the notebook in your browser
marimo edit notebooks/tutorial.py
Customizing parameters
The most important prettymaps.plot() parameters are:
layers— dict of OpenStreetMap layers to fetch.style— dict of matplotlib style parameters per layer.preset— load a JSON preset (e.g.'default','minimal','macao','tijuca').circle/radius/dilate— boundary shape.
plot is a dataclass with geodataframes (per-layer GeoDataFrames), fig, and ax.
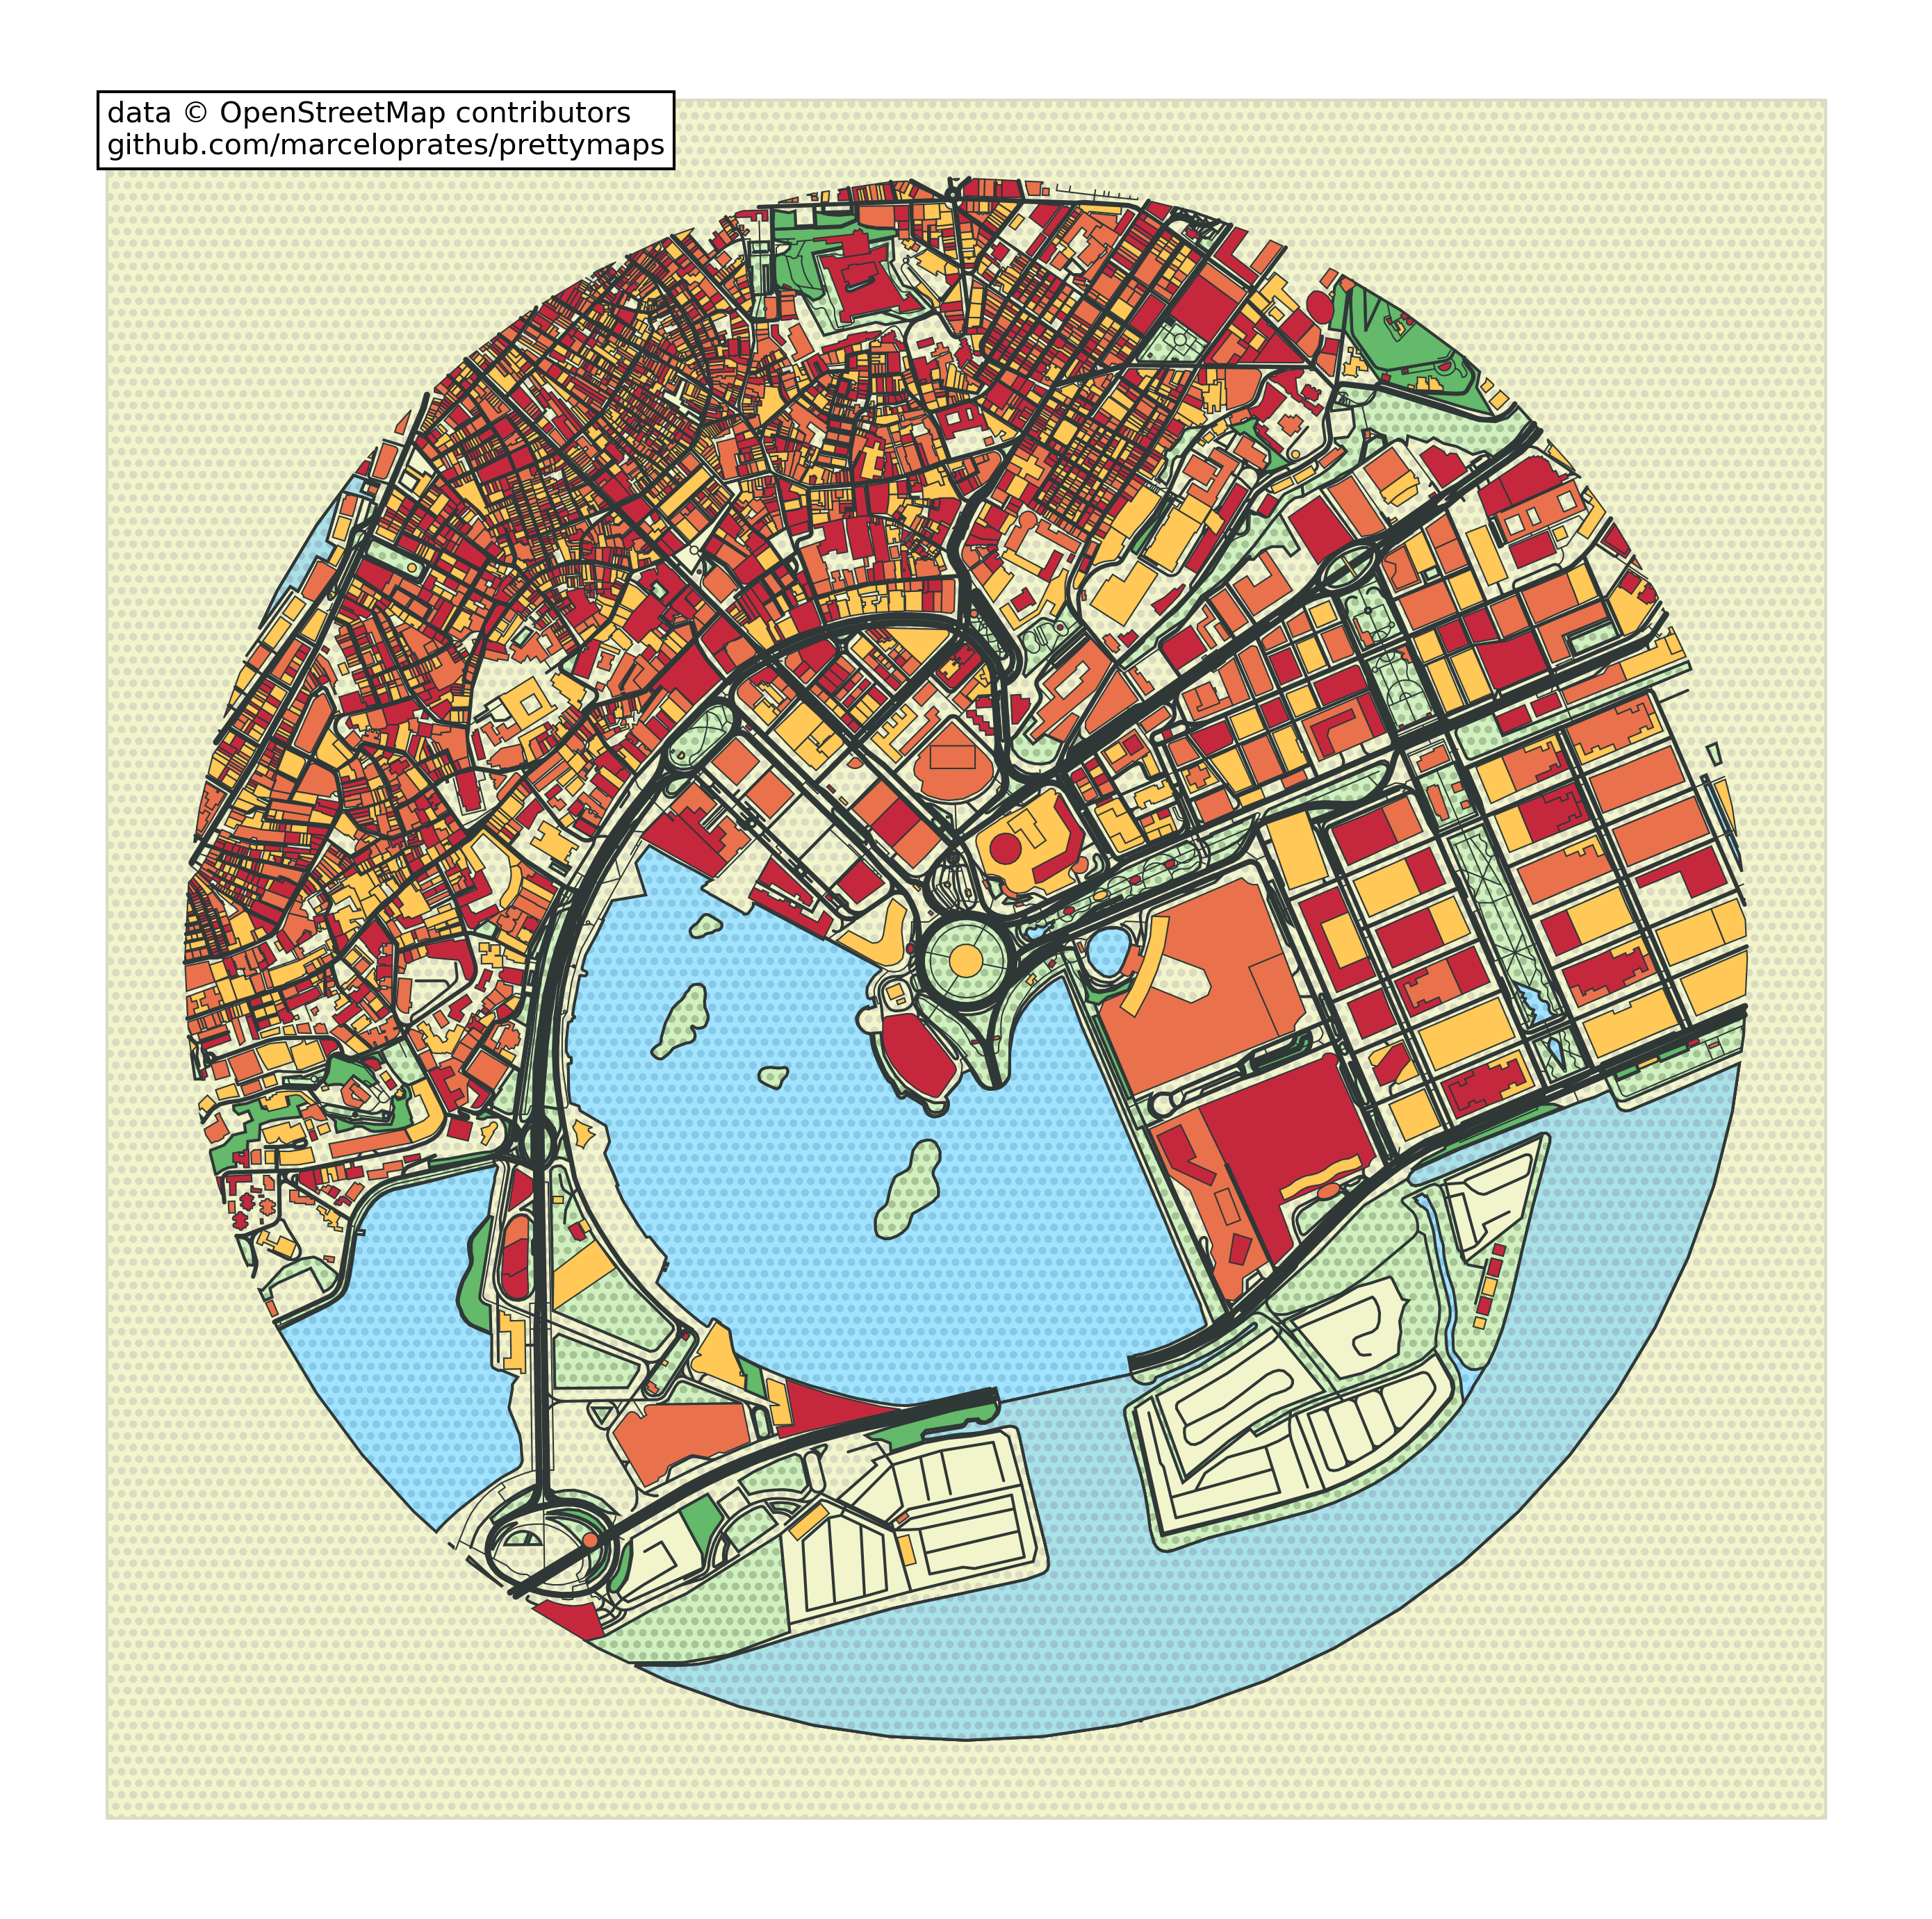
plot = prettymaps.plot(
    'Praça Ferreira do Amaral, Macau',
    circle=True,
    radius=1100,
    layers={
        "water": {"tags": {"natural": ["water", "bay"]}},
        "building": {"tags": {"building": True}},
    },
    style={
        "water": {"fc": "#a1e3ff", "ec": "#2F3737"},
        "building": {"palette": ["#FFC857", "#E9724C", "#C5283D"]},
    },
)
See docs/tutorial.md for the full set of examples (Macau, Bom Fim, mosaic, Barcelona plotter, Tijuca, multiplot, hillshade, Garopaba keypoints).