Star 历史趋势
数据来源: GitHub API · 生成自 Stargazers.cn
README.md
ggraph - Graph visualization for messy data


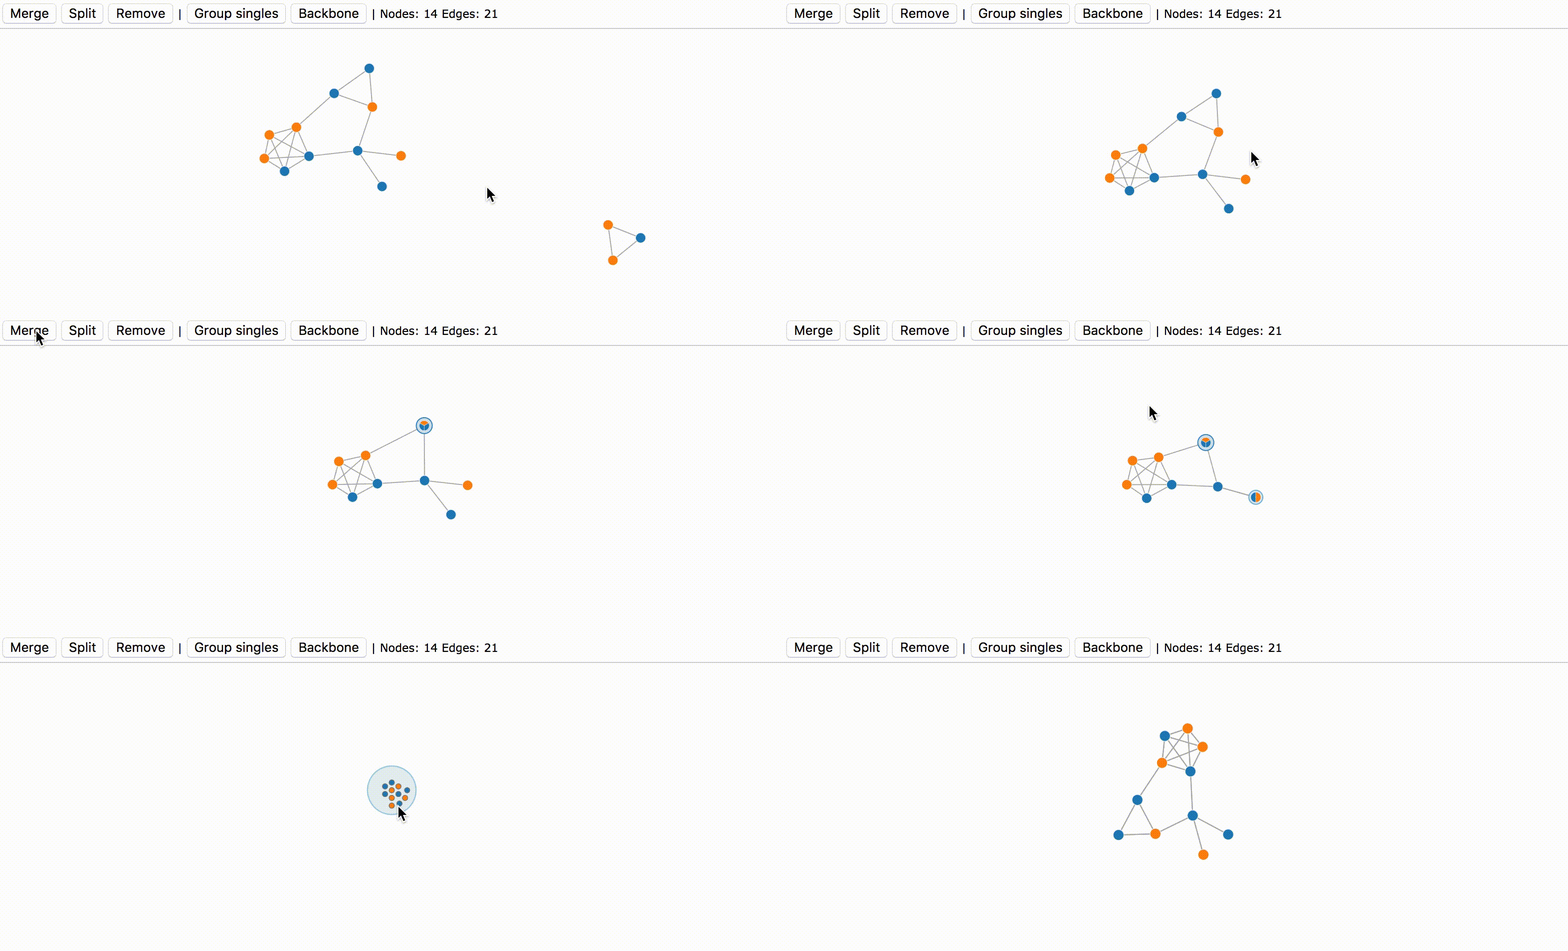
This is a library built on top D3 with the goal of improving how we work with large and messy graphs. It extends the notion of nodes and links with groups of nodes. This is useful when multiple nodes are in fact the same thing or belong to the same group.
Live demo: https://gransk.com/ggraph.html
Some examples of nodes that may belong together:
- IPs in the same subnet
- Emails / monikers
- File fingerprints
- Bitcoin addresses in same wallet
- Alternative spellings and typos
Data model
The easiest apporach is to call ggraph.convert with a valid D3 object:
var graph = {
  nodes:[
    {id: "Maria West", type: "female"},
    {id: "Hazel Santiago", type: "male"},
    {id: "Sheldon Roy", type: "male"}
  ],
  links: [
    {source: "Maria West", target: "Hazel Santiago", value:100},
    {source: "Maria West", target: "Sheldon Roy"}
  ]
}

converted = ggraph.convert(graph);
Usage
Initialization:
ggraph.init('container', 25); // Marker timeout
ggraph.draw(converted);
Merge nodes into groups:
// Merge selected
ggraph.merge(selection.all());

// Into single group
ggraph.merge(['Maria West', 'Sheldon Roy']);

// Into several groups
ggraph.merge([
  ['A', 'B'],
  ['C', 'D']
]);
Split and remove:
ggraph.split(['Maria West', 'Sheldon Roy']);
ggraph.remove(['Maria West', 'Hazel Santiago']);
Building
git clone https://github.com/pcbje/ggraph && cd ggraph
npm install
node_modules/.bin/karma start tests/cover.conf.js
node_modules/.bin/karma start tests/watch.conf.js
node_modules/.bin/grunt min
Disclaimer
This is a work in progress. Contributions are very much welcome!