📝 Launch blog · 🌐 Website · 📚 Learn Tokenomics
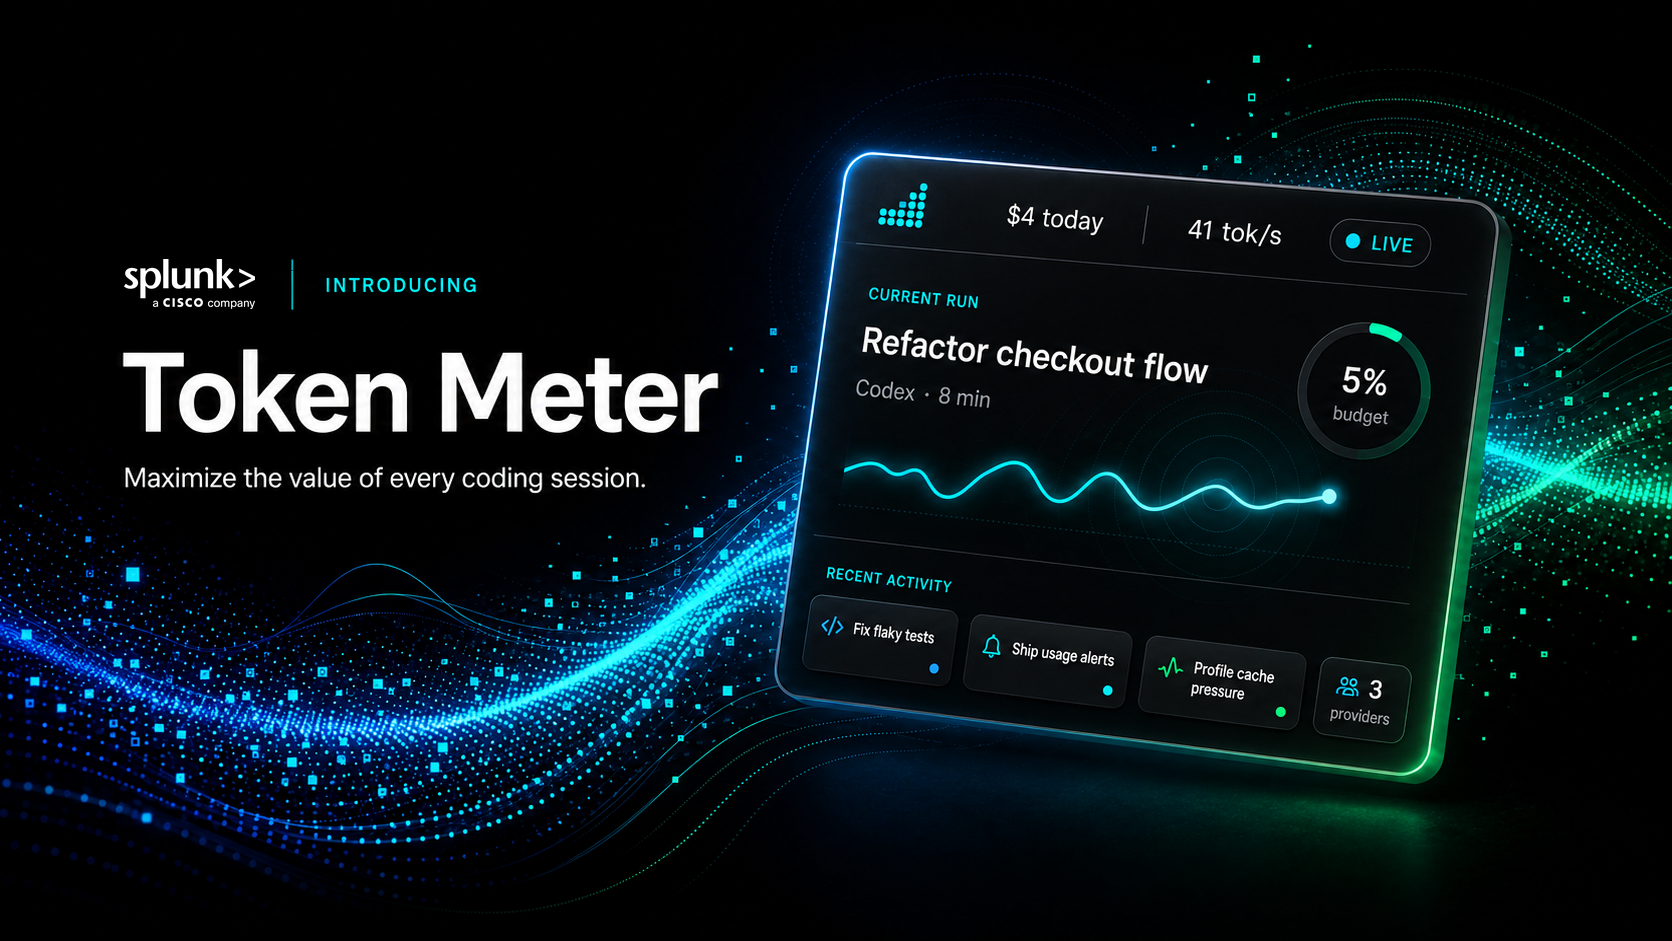
Token Meter is a local-first observability dashboard for AI coding agents. It turns session evidence from Claude, Codex, Cursor, OpenCode, Kiro, and Pi into one view of what happened, what it cost, and where time went—so you can decide whether to continue, intervene, compare, or investigate a run.
Python standard library only. No API keys for trace analysis. No Token Meter analytics or telemetry leaves your machine.
Quick Start
macOS or Linux
git clone https://github.com/splunk/token-meter.git
./token-meter/scripts/install
The installer stages a stable per-user runtime, starts the local server and native companion, and configures automatic startup.
Windows
Beta: The Windows extension is still in beta.
powershell.exe -NoLogo -NoProfile -ExecutionPolicy Bypass -Command '$p=Join-Path $env:TEMP "token-meter-bootstrap.ps1"; try { Invoke-WebRequest -UseBasicParsing "https://raw.githubusercontent.com/splunk/token-meter/main/scripts/bootstrap-windows.ps1" -OutFile $p; & $p } finally { Remove-Item -LiteralPath $p -Force -ErrorAction SilentlyContinue }'The bootstrap uses WinGet from Microsoft App Installer to install missing Git and Python.
It then stages the beta extension without administrator access. From an
existing checkout, rerun .\scripts\install-windows.cmd.
Open Token Meter
Open http://127.0.0.1:8722, start a normal agent run, and choose it from Sessions.
For requirements, development startup, updates, uninstall commands, and troubleshooting, see the User guide.
Windows beta uninstall:
powershell.exe -NoLogo -NoProfile -ExecutionPolicy Bypass -File "$env:LOCALAPPDATA\Token Meter\runtime\scripts\uninstall-windows.ps1"
What You Can Do
| Goal | Token Meter helps you |
|---|---|
| Understand a live run | Follow estimated cost, tokens, context pressure, wait, output pace, tool calls, execution evidence, and session-budget alerts. |
| Review history and spend | Find expensive or slow work across sessions, projects, runtimes, platforms, and calendar ranges. |
| Compare models and execution | Compare input, output, pace, wait, and workload shape without presenting weak matches as meaningful results. |
| Investigate tools and skills | Find high-output, failing, repeated, unobserved, or deferred capabilities while keeping incomplete evidence explicit. |
| Manage usage | Check provider-reported limits, allocate a monthly budget, receive threshold notifications, and let Codex or Claude query bounded evidence through the local MCP. |
Coverage
Runtimes: Claude Code and Desktop Agent/Cowork, Codex CLI and desktop, Cursor Agent/Composer, OpenCode, Kiro, and Pi.
| Platform | Status | Experience |
|---|---|---|
| macOS | Supported | Browser dashboard and native menu-bar companion |
| Linux | Supported | Browser dashboard and AppIndicator tray companion |
| Windows | Beta | Browser dashboard and notification-area extension |
Evidence varies by runtime and client version. Missing values remain unavailable instead of appearing as a misleading zero.
Token Meter works when the agent keeps session evidence on your machine in a supported local store. Sessions that exist only in a cloud-hosted service may not be available to Token Meter.
First Five Minutes
- Open Sessions → Current sessions and select an active run.
- Under Run, check cost, context pressure, Output/$, and Reasoning ratio. Add a session budget if the run needs an attention limit.
- After more sessions accumulate, use Spend, Models, Tools, Efficiency, and Git to review longer-term patterns.
Product Tour
Follow a session
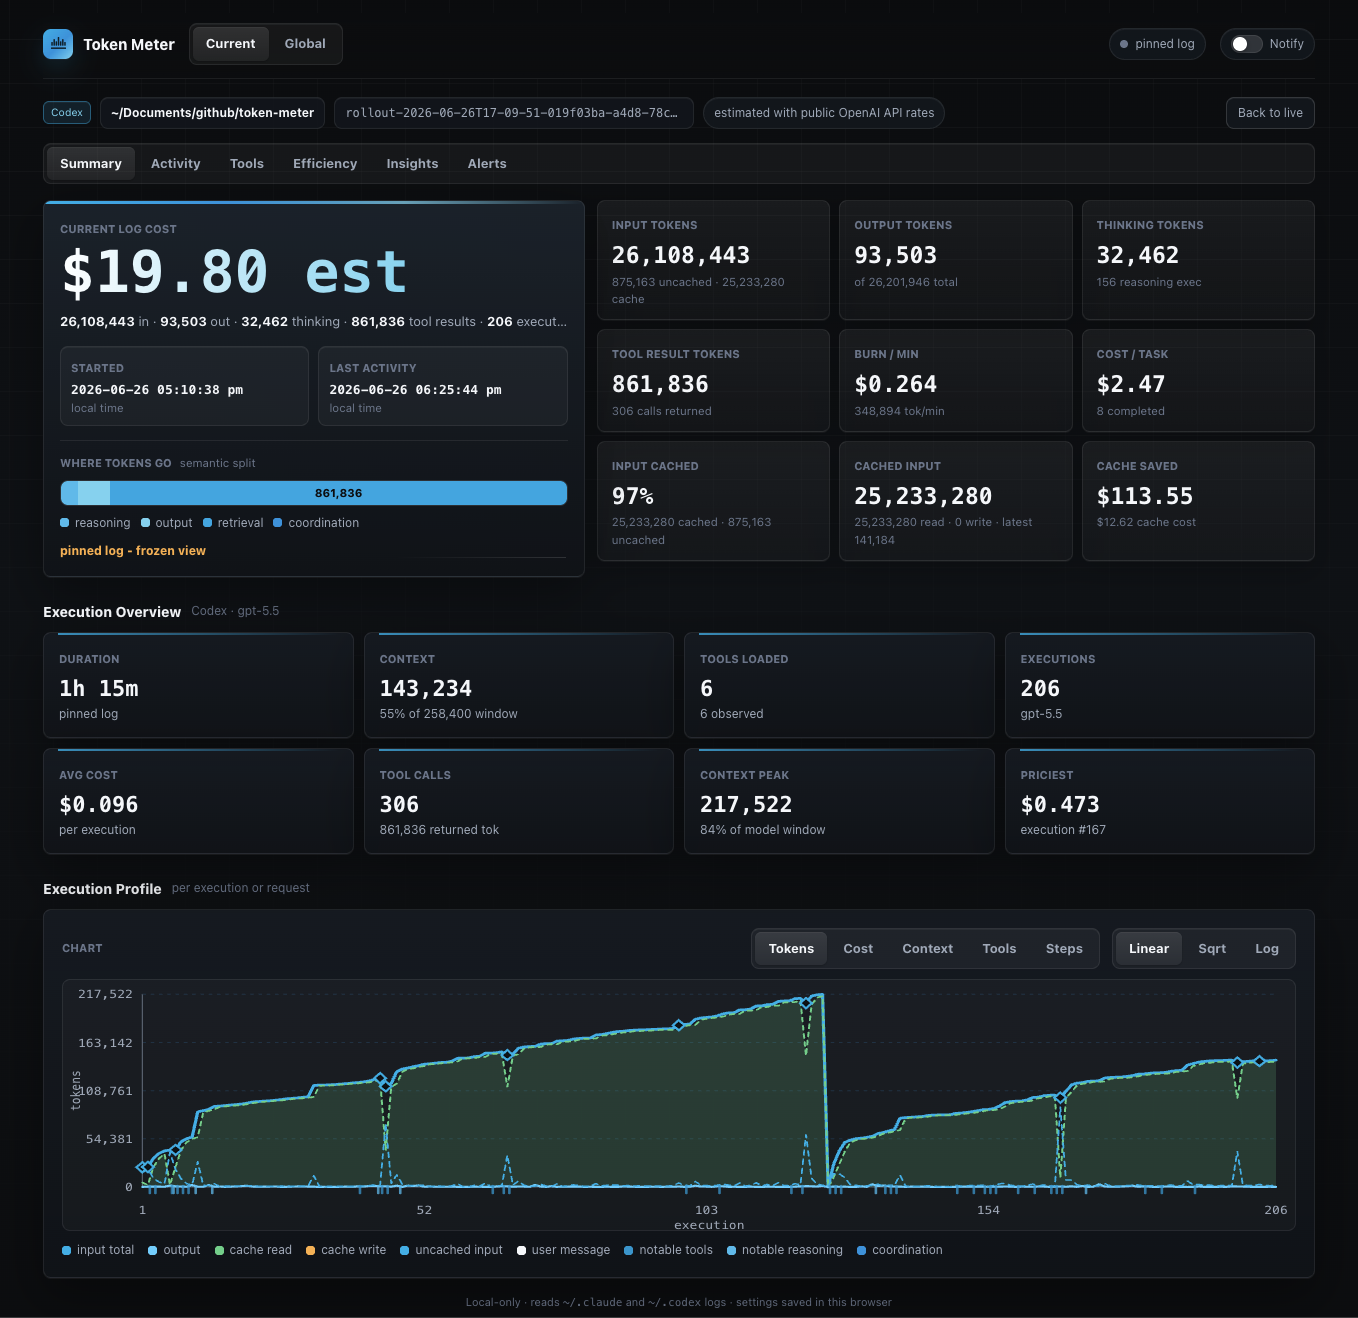
Run keeps usage, execution, tool, and budget evidence together on one focused session page.
Understand spend
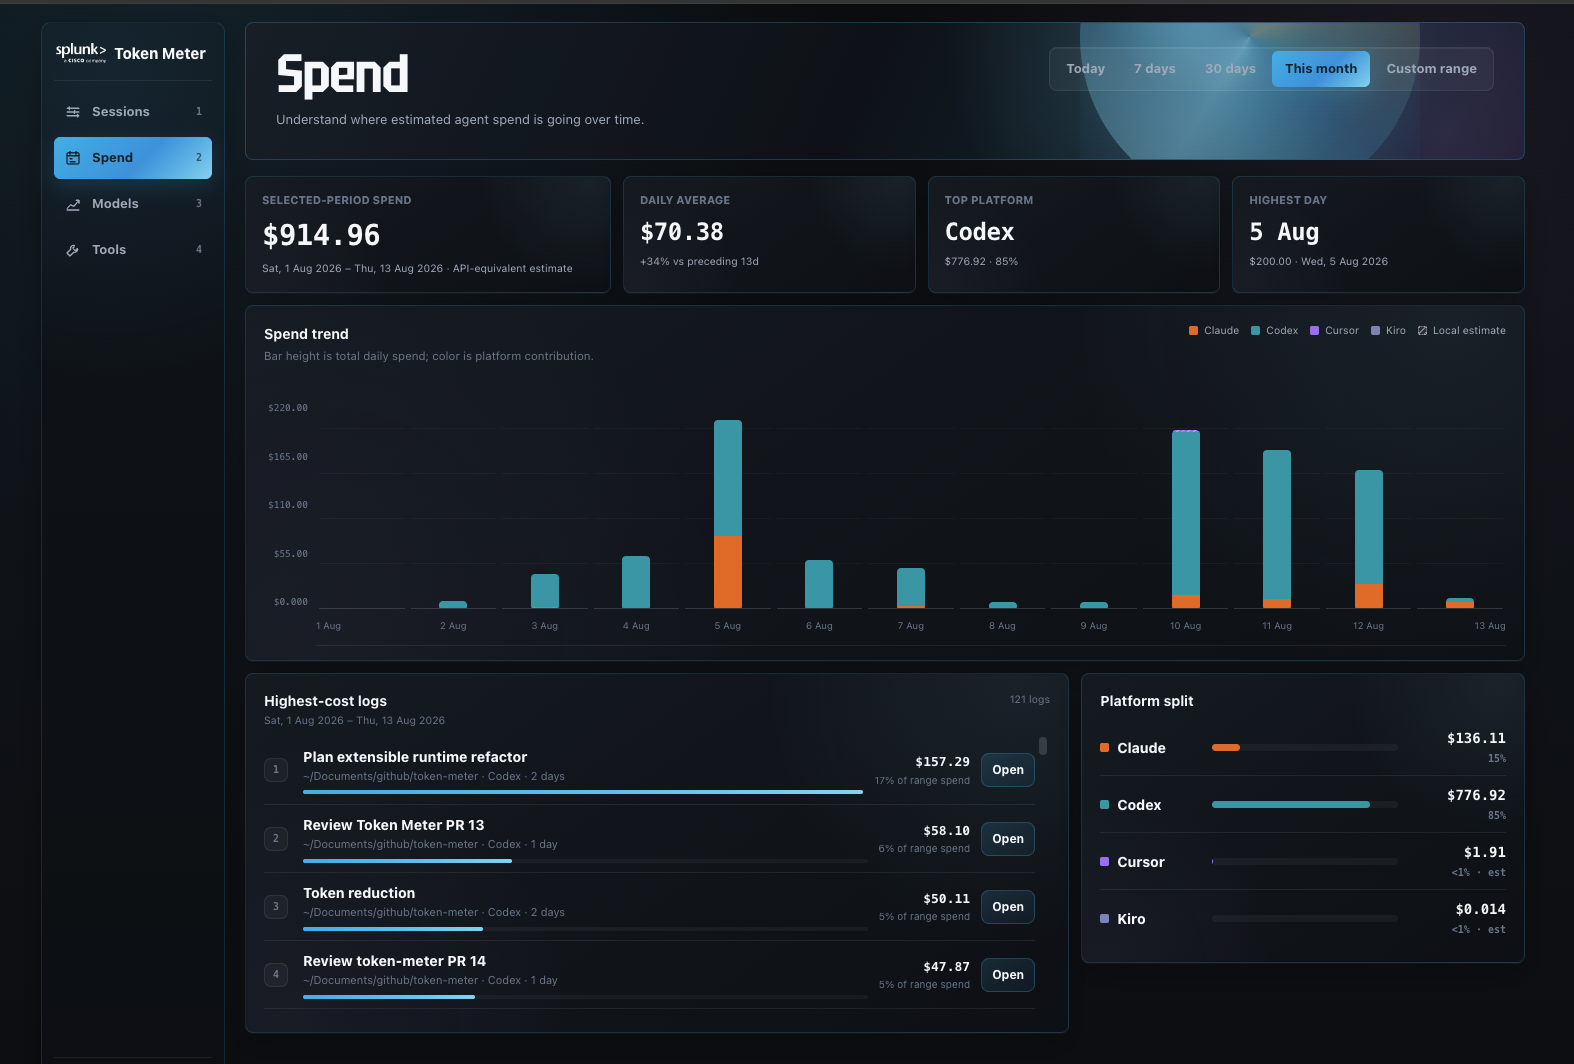
Compare Today, 7-day, 30-day, This month, or a custom period across platforms, projects, runtimes, and sessions. Spend concentration, percentile session shapes, and a clickable cost-or-input versus active-time map expose which runs deserve inspection.
Inspect tools and skills
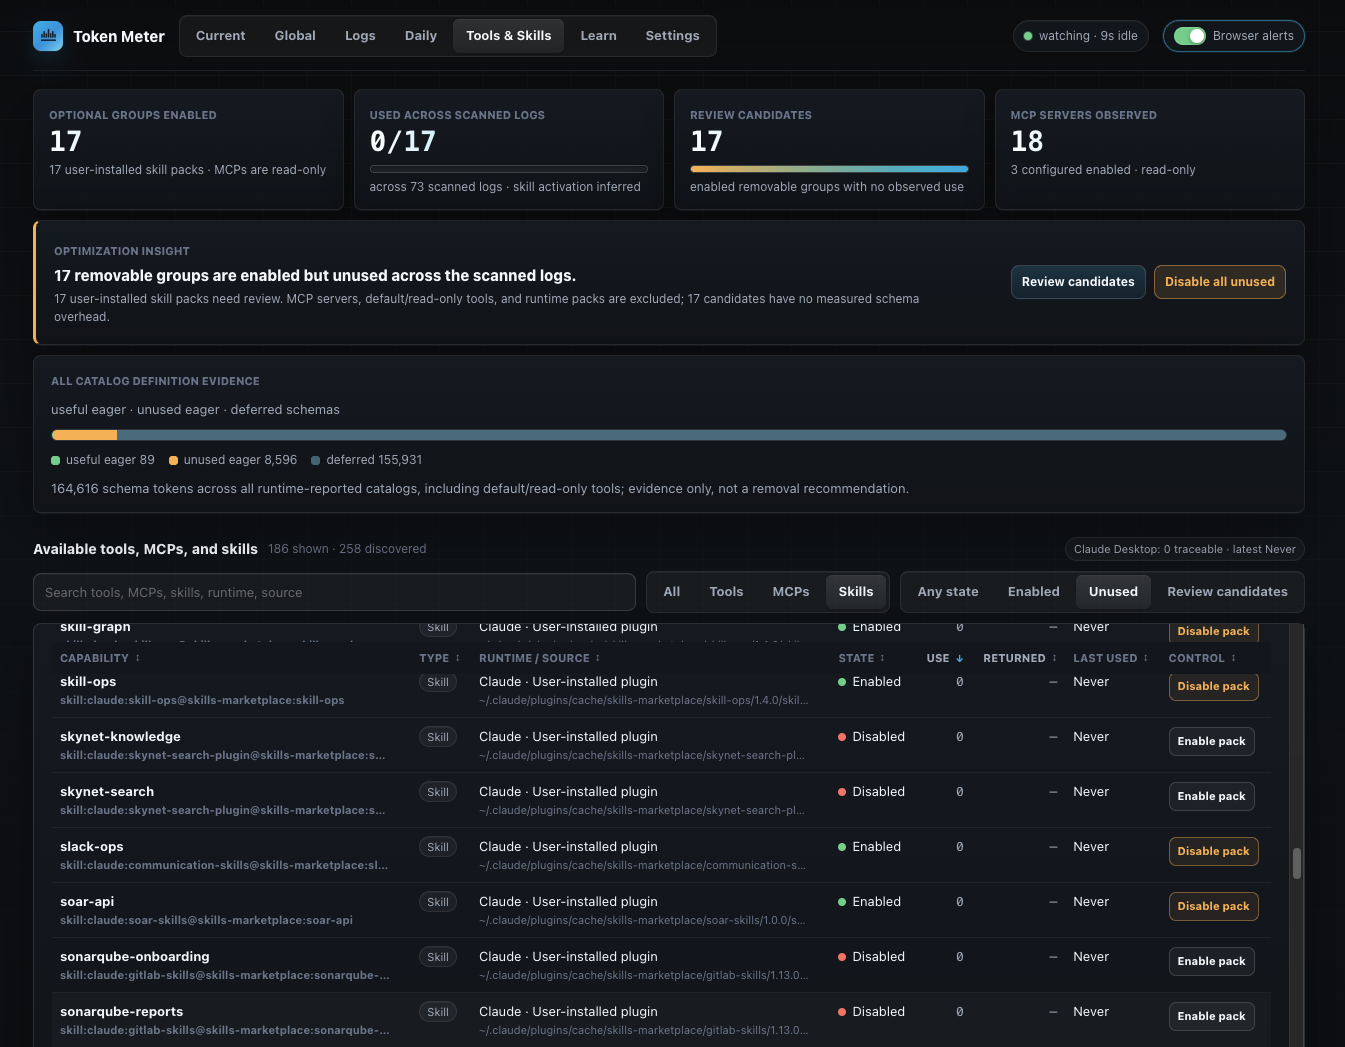
Review observed calls, output estimates, failures, repeats, catalog exposure, skill-pack activation, and bounded review candidates.
Check token efficiency
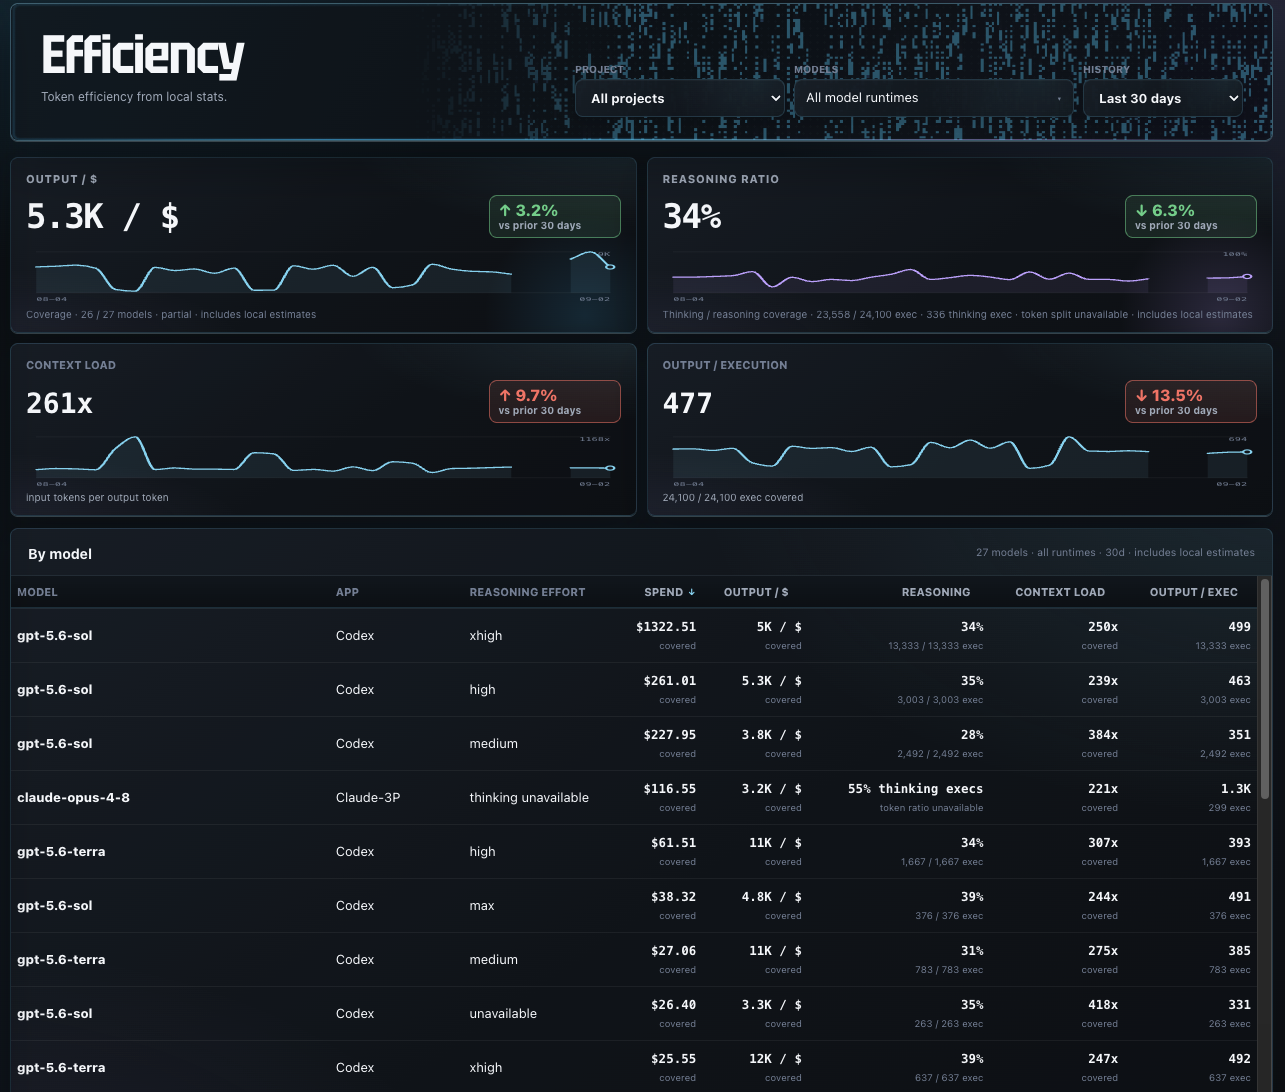
Use Efficiency to compare four signals over comparable, covered work:
- Output / $: reported output tokens per covered dollar. Higher is better over time because more output is reaching the response for the spend.
- Reasoning ratio: reported reasoning tokens as a share of output. Lower or stable is usually better for comparable work, while difficult work may need more reasoning.
- Context load: processed input tokens per output token. Lower is better because less context is carried into each response.
- Output / execution: output tokens per covered run. Higher generally means a less fragmented workflow.
Each headline includes a daily trend, and partial coverage or unavailable evidence stays labelled beside the numbers.
Git
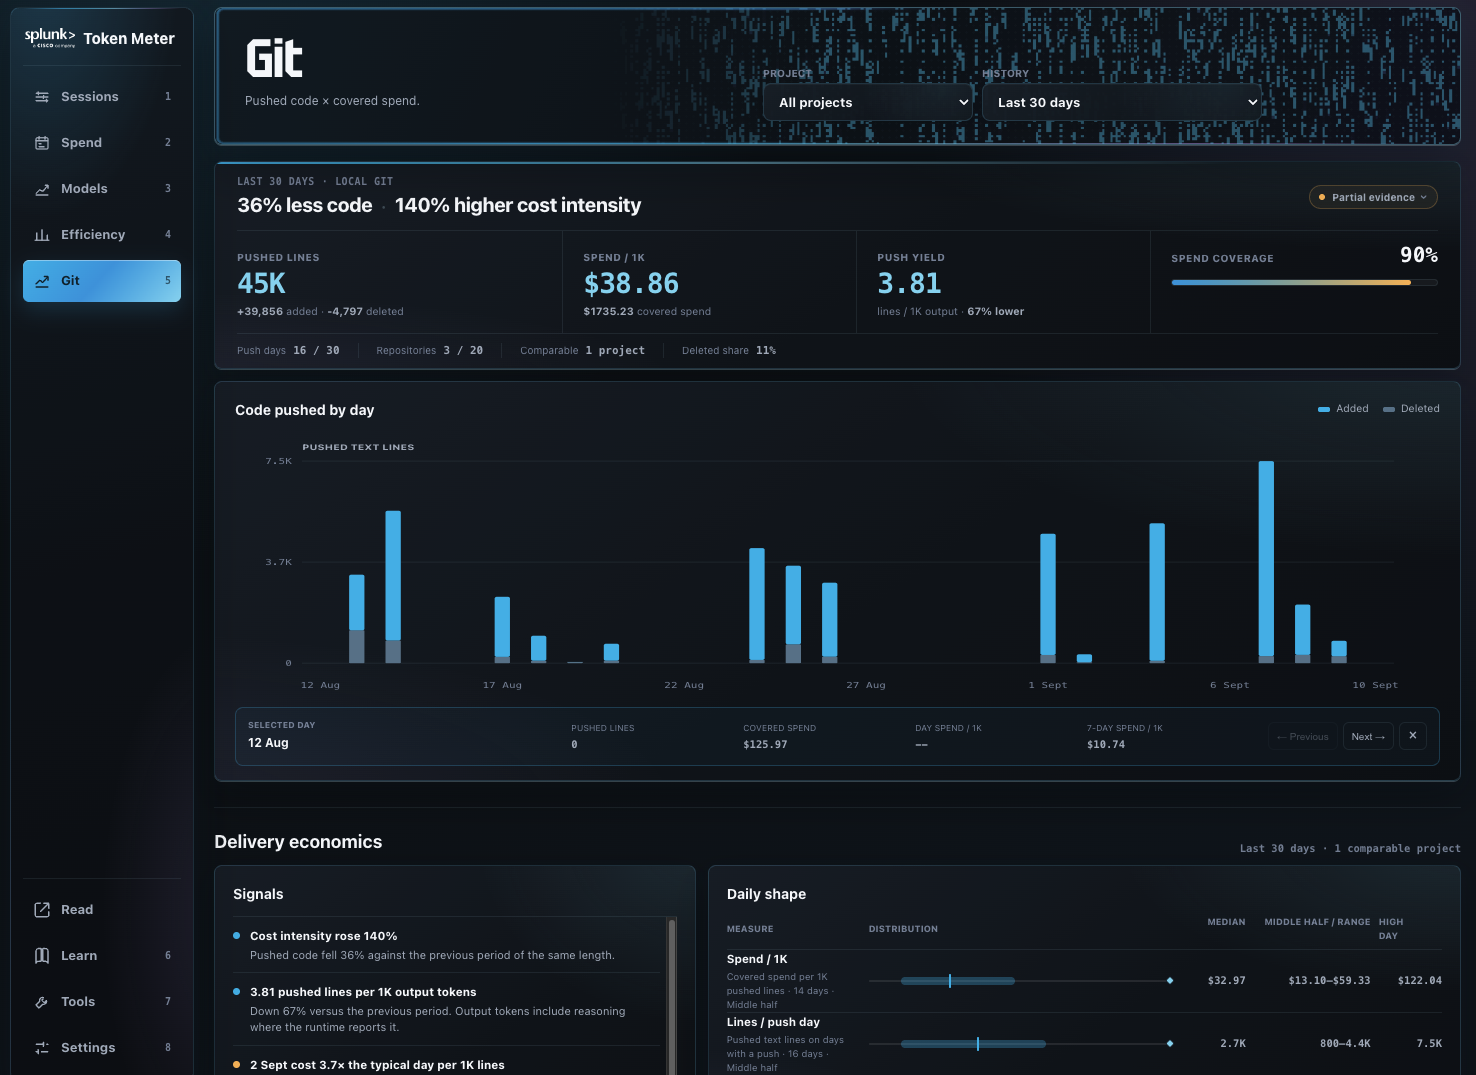
Git pairs successful local pushes with covered spend, so you can see code
changed by project and day. It uses local git evidence only—never remote
requests—and clearly marks partial or unavailable coverage. It is a mechanical
signal, not a code-quality or productivity score.
Configure budgets and agent access
Manage monthly budgets, model pricing, language signals, native preferences, and local read-only connections for Codex and Claude. Software update checks and automatic installation are separate settings; both are on by default.
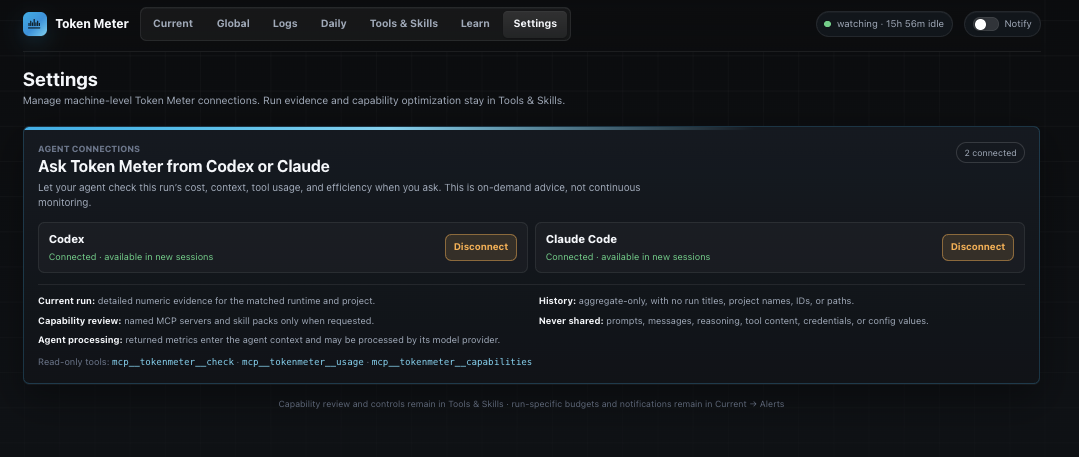
The local MCP exposes seven read-only tools:
| Tool | Use |
|---|---|
check | Make a bounded decision about the caller-matched current run. |
usage | Review aggregate spend, model, tool, or change evidence. |
capabilities | Review optional user-installed skill-pack evidence. |
sessions | Select content-free session IDs using runtime, client, model, state, or time filters. |
trace | Read a standardized trace or sanitized runtime-native structure for one session. |
stats | Aggregate selected token, cost, timing, context, attempt, model-call, or tool metrics. |
schema | Discover fields, dimensions, units, limits, and availability semantics. |
A comparison harness can call sessions, pass one returned ID to trace, and
then call stats with dimensions such as runtime, model, day, or
session_id. List responses expose page.next_cursor; continue by replaying
the same query with that cursor. Metrics retain measured, estimated, inferred,
and unavailable coverage, so missing evidence is not silently treated as zero.
The native_structure trace view is not raw trace content. It keeps only
allowlisted event types/subtypes, model and tool identities, statuses,
relationships, timestamps, and numeric evidence. It does not expose raw trace
content, prompts, responses, reasoning text, tool payloads, or trace paths.
Check without opening the dashboard
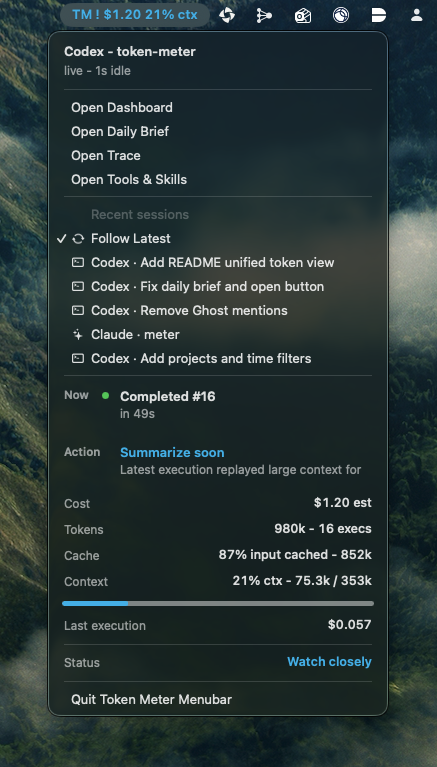
Use the macOS menu bar, Linux tray, or beta Windows extension to reach the
current or pinned run. The native clients read a compact local payload and do
not parse traces or read provider credentials directly. Token Meter checks for
updates every 10 minutes and installs safe main updates automatically by
default, so normal updates do not require opening the dashboard. If automatic
installation is off, the native menu shows New update available instead.
Evidence and Privacy
Token Meter reads local runtime stores and binds its dashboard to 127.0.0.1.
It does not upload traces, prompts, responses, project paths, token counts,
costs, or derived analytics. Do not expose the localhost dashboard publicly.
Costs and selected token values can be estimates. Codex cost uses public API-equivalent rates, which can differ from subscription billing; Cursor usage includes local proxies where authoritative values are unavailable; Pi cost are estimates based on model API pricing.
The optional MCP returns bounded derived evidence, not prompts, responses, reasoning, tool contents, credentials, settings, or trace paths. A result sent to an explicitly connected agent may be processed by that client's model provider under its own terms. See the User guide for the full evidence semantics and Security policy for the canonical boundary.
Documentation
| Document | Use it for |
|---|---|
| User guide | Requirements, daily use, MCP, updates, uninstall, evidence semantics, and troubleshooting |
| Security | Privacy and security boundaries or vulnerability reporting |
| Architecture | Components, data flow, runtime adapters, and extension contracts |
| Contributing | Issues, pull requests, development, and validation |
| Product principles and visual design | Product and experience decisions |
| Specifications and plans | Maintained feature designs and implementation plans |
License
MIT. See LICENSE.